Figure 1.
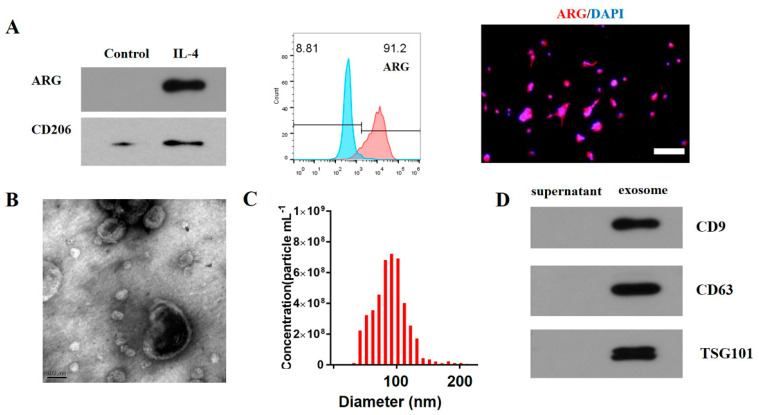
Characterization of M2 macrophages and exosomes. Western blot analysis of ARG and CD206 protein levels (A). Flow cytometry showed that 91.2% of cells were ARG+ cells (A). Immunofluorescence stain of the surfer markers—ARG (red) of M2 macrophages (A). The transmission electron micrograph of exosomes (B). The NTA of the exosomes (C). The exosome specific markers (e.g., TSG101, CD63, and CD9) were detected by WB (D). Scale bar = 100 µm (A). Scale bar = 100 nm (B).

