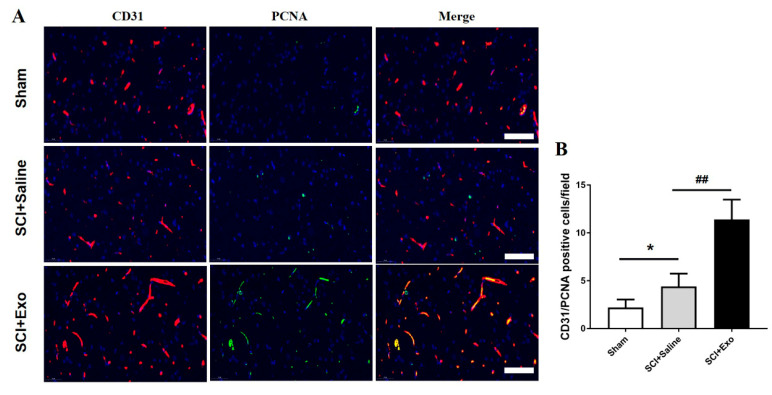
Figure 4.
The administration of M2 macrophage exosome-induced endothelial cell proliferation after SCI in vivo. Representative images of PCNA+ (green) and CD31+ (red) cells in the anterior horn of the SC after 3 days of SCI (A). Quantification of PCNA/CD31+ cells in the injured SC (B). Mean ± SD. * p < 0.05 SCI + saline group versus sham group, ## p < 0.01 SCI + Exo versus saline group. N = 5 per group. Bar = 50 µm.

