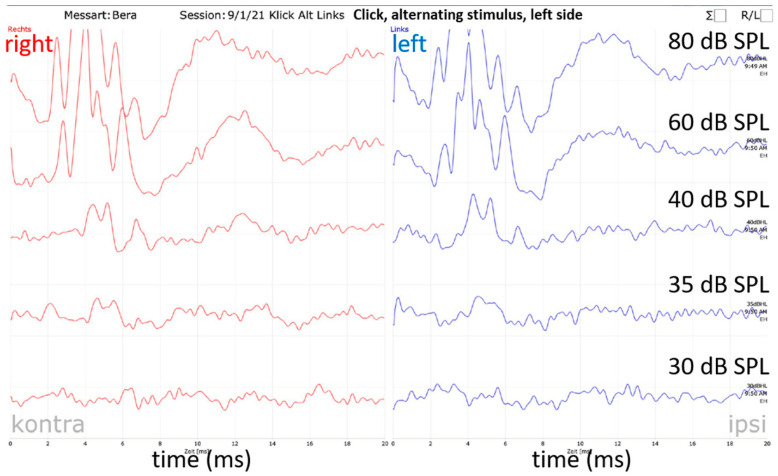
Figure 3.
Hearing threshold determination. The visual hearing threshold determination exemplified by a naïve (d −7) click measurement of the left side. It is a printout of the software’s evaluation file. Blue curves show the left-side recordings (stimulated side) and red curves the right-side recordings. Since there is no clear ABR signal on the left side below 35 dB, the hearing threshold was set at 35 dB SPL.

