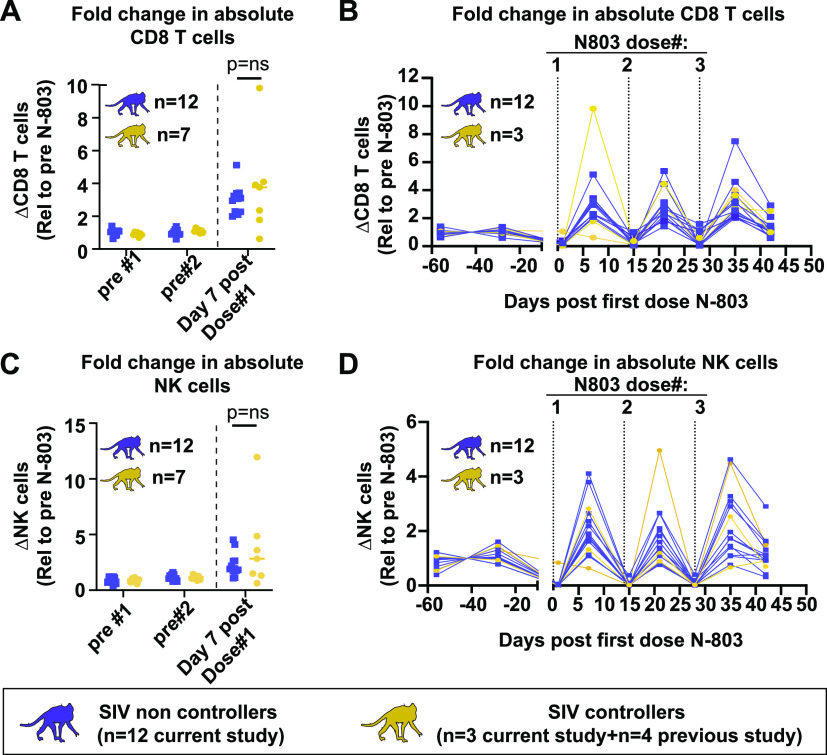
FIG 4.
No differences were observed in the increases of bulk CD8 T cells or NK cells between the SIV controllers and noncontrollers during the N-803 treatment. (A–D). PBMC from SIV noncontrollers (purple) or SIV controllers (gold) collected at the indicated time points post-N-803 treatment were stained with the panel originally described in Table 3 of (20). The frequency of CD8 T cells (defined as CD3+CD8+ cells; panels A and B) and NK cells (defined as CD3−CD8+NKG2A+ cells; panels C and D) were determined. Complete white blood cell counts (CBC) were used to quantify the absolute number of each cell population. Then, the data were normalized to the average value for the pretreatment controls for each population and are displayed as the fold changes in absolute cell counts, relative to the pretreatment average. For panels A and C, Mann-Whitney tests were performed to determine statistical significance. P = ns, not significant.

