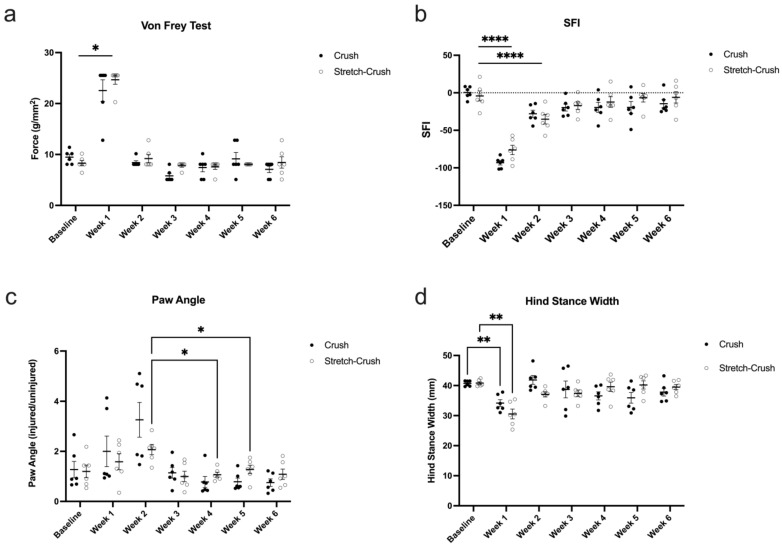
Figure 5.
Behavioral and VGL metrics evaluated over six weeks. Results of crush-injured nerves compared to stretch–crush injured nerves and contralateral uninjured nerves (sham). (a) Von Frey test shows significant differences at week one in both groups compared to baseline, with a return towards baseline thereafter. (b) SFI follows a similar temporal profile of recovery as (a) with statistically significant measurements for both groups at week one and two compared to baseline. For HPA (c), measured as the ratio of the injured leg’s paw angle over the uninjured leg’s paw angle as assessed by VGL between injury models and across time, there was a surprising peak at week two. No significant differences between injury models were demonstrated; there was a trend, but nonsignificant interaction, between injury type and time (stretch–crush at week two compared to week four and five, p = 0.0672). (d) HSW analysis as assessed by VGL between injury models and across time showed significant differences for both groups at first week compared to baseline, with a similar kinetics of recovery over time, as the von Frey test (a) with return to baseline thereafter. Statistics were performed using a two-way repeated measures ANOVA. Error bars represent standard error of the mean (SEM). * = p < 0.05, ** = p < 0.01, **** = p < 0.0001. ANOVA, analysis of variance; HPA, hind paw angle; HSW, hind stance width; NCV, nerve conduction velocity; SFI, sciatic functional index; VGL, Visual Gait Lab.

