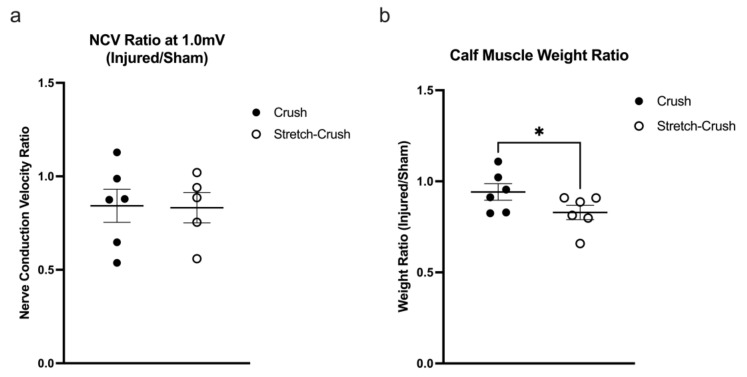
Figure 6.
Electrophysiological and muscle weight assessment. (a) Comparison of NCV of crush and stretch–crush injured legs relative to contralateral uninjured legs (sham) at the six-week study termination point. Note that the average NCV ratios remain <1, but do not differ significantly between injury conditions. (b) Calf muscle weight comprised of the combined weight of the gastrocnemius and soleus muscles measured at the study termination point at six weeks following injury and converted into a ratio of the injured leg over the uninjured leg. Reduced calf muscle weight in the stretch–crush condition compared to the crush alone shows significant difference (p < 0.05). Statistics were performed using a one-tailed unpaired t-test. Error bars represent standard error of the mean (SEM). * = p < 0.05. NCV, nerve conduction velocity.

