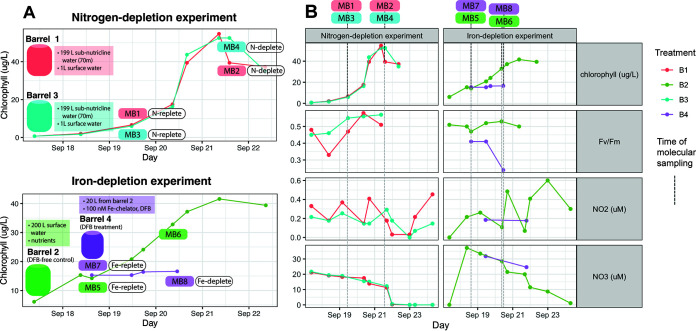
FIG 1.
(A) Illustration of experimental design for nitrogen depletion (top) and iron depletion (bottom) experiments. The nitrogen depletion experiment consisted of incubation barrels B1 and B3 (red and blue), and the iron depletion experiment consisted of barrels B2 and B4 (green and purple). Timing of molecular samples (MB1 to -8) is shown superimposed over chlorophyll concentrations (y axis; colored by barrel). In the nitrogen depletion experiment, barrels 1 (red) and 3 (blue) were duplicates, both containing 199 L subnutricline water sampled from a 70-m depth and 1 L of surface water. In the iron depletion experiment, barrel 2 (green) contained 200 L of surface water with nutrients added to achieve final concentrations of 40 μM nitrate, 2.5 μM phosphate, and 50 μM silica. In this barrel, iron levels were left unmanipulated as a control. On September 18, barrel 4 (purple) was created by subsampling 20 L from barrel 2. In barrel 4, a low-iron environment was created with the addition of the Fe chelator DFB (final concentration, 100 nM). (B) Chlorophyll, Fv/Fm (variable fluorescence/maximum fluorescence), nitrite, and nitrate measurements across time for all experimental conditions (see SD2 at https://doi.org/10.5281/zenodo.6953574; barrels colored as described in the legend to panel A). Timing of molecular samples is given by dotted gray vertical lines.

