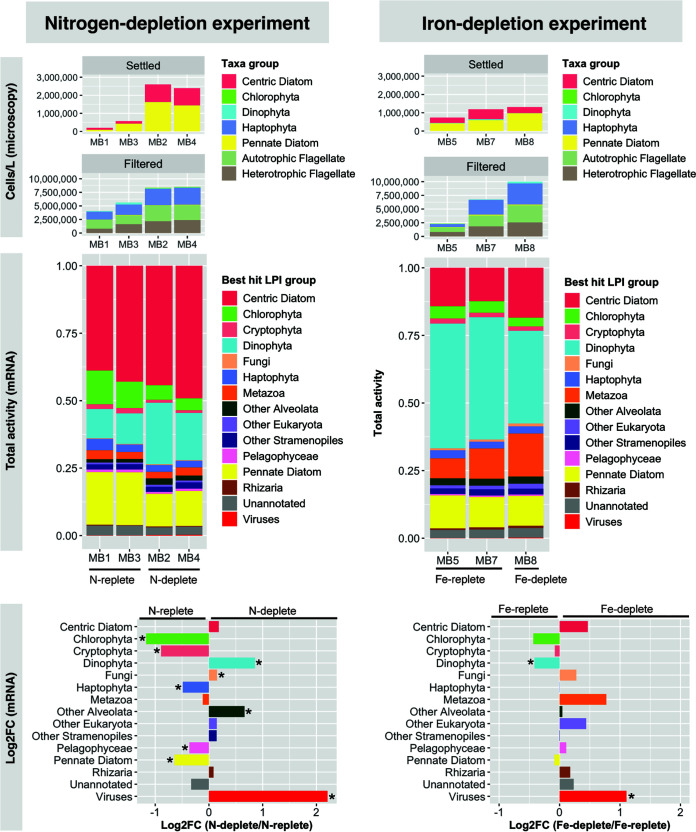
FIG 2.
Coarse taxonomy across both experiments via cell counts (top), proportions of total mRNA (middle), and differential abundances of taxon group mRNA (bottom) across nutrient conditions. For microscopy (top), “settled” cells represent large diatoms and dinoflagellates that were separated via Utermöhl settling technique and “filtered” cells represent small taxa that could only be counted after collection on an 0.8-μm filter. For differential mRNA abundance (bottom), log2 fold changes of taxon group activities are depicted as proportions of library reads across nitrogen (left) and iron (right) conditions. Asterisks denote significant differences (edgeR, FDR < 0.05). MB6 was not included in the differential expression analysis because, although no iron chelator was added, it appeared to be iron limited due to being a late-stage bloom condition.

