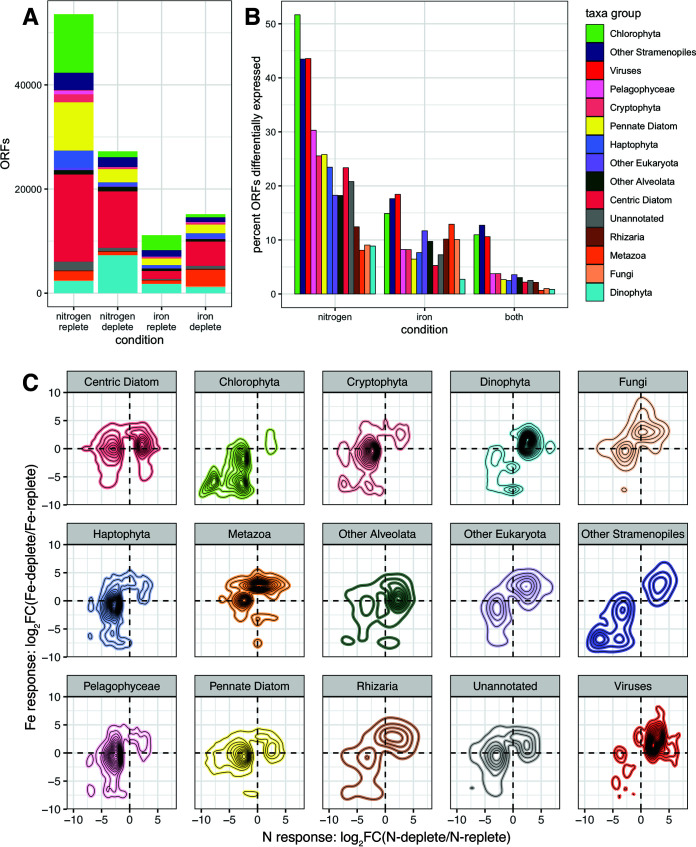
FIG 4.
(A) Numbers of ORFs significantly upregulated under nitrogen-replete, nitrogen-depleted, iron-replete, and iron-depleted conditions, colored by taxonomy. (B) Percentage of ORFs from each taxon group that are significantly differentially expressed across nitrogen conditions, iron conditions, and both types of nutrient limitation. (C) Two-dimensional histograms characterizing the transcriptional responses of ORFs from major lineages to nitrogen and iron status (y axis, log2FC(Fe depleted/Fe replete), >0 is up in low iron, <0 is down in low iron) and nitrogen (x axis, log2FC(N depleted/N replete), >0 is up in low nitrogen, <0 is down in low nitrogen). Only ORFs that were significantly differentially expressed (FDR < 0.05) under at least one condition (N, Fe, or both) are included.

