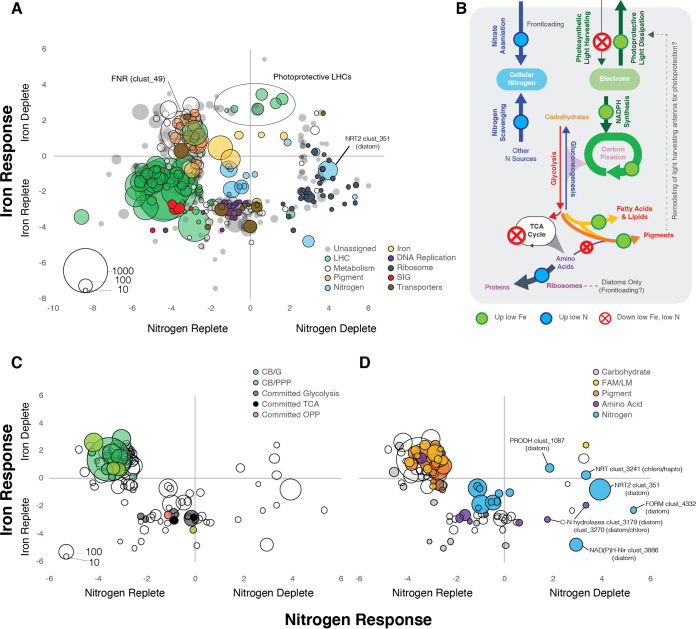
FIG 6.
(A) Responses of major clusters of diatom, dinoflagellate, chlorophyte, haptophyte, and pelagophyte ORFs to iron and nitrogen status. The average log2FC of ORFs within each cluster is shown across nitrogen conditions (x axis) and iron conditions (y axis). Clusters were filtered by the following criteria: >10 ORFs, at least one significantly differentially expressed ORF for either N or Fe per cluster (taxon group-wise edgeR FDR of <0.05), and average cluster abs(log2FC) of >2.5 for either N or Fe. Clusters were assigned to general cellular functions based on annotations of ORFs within the clusters (see SD15 at https://doi.org/10.5281/zenodo.6953574). Some clusters with functions in iron and nitrogen metabolism that did not meet the abs(DE) of >2.5 criteria are also plotted. LHC, light-harvesting complex; SIG, sexually induced gene. (B) Integrated model of energetic inputs and pathway flux (inferred from transcripts). (C, D) Open circles show metabolism gene clusters (from panel A), colored according to assignment to different pathways. abs, absolute value; CB, Calvin Benson; G, glycolysis/gluconeogenesis; PPP, pentose phosphate pathway (oxidative or reductive); TCA, tricarboxylic acid cycle; OPP, oxidative pentose phosphate; FAM/LM, fatty acid metabolism/lipid metabolism.

