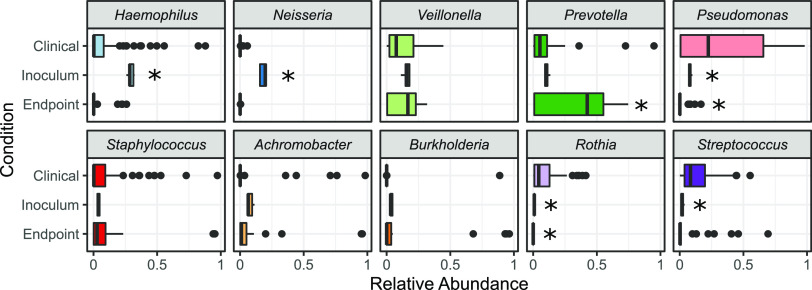
FIG 10.
Most endpoint experimental taxa fall within the range of clinically observed relative frequencies. The relative abundances of taxa in synthetic microbiome inocula and endpoints (30 samples) compared to 77 clinical cohort observations (57). The box represents the interquartile range (from 25% to 75% of samples), with the horizonal line at the median. Outliers are represented as dots (two-tailed Welch’s t test versus clinical data with Bonferroni multiple testing correction; *, corrected P < 0.001).

