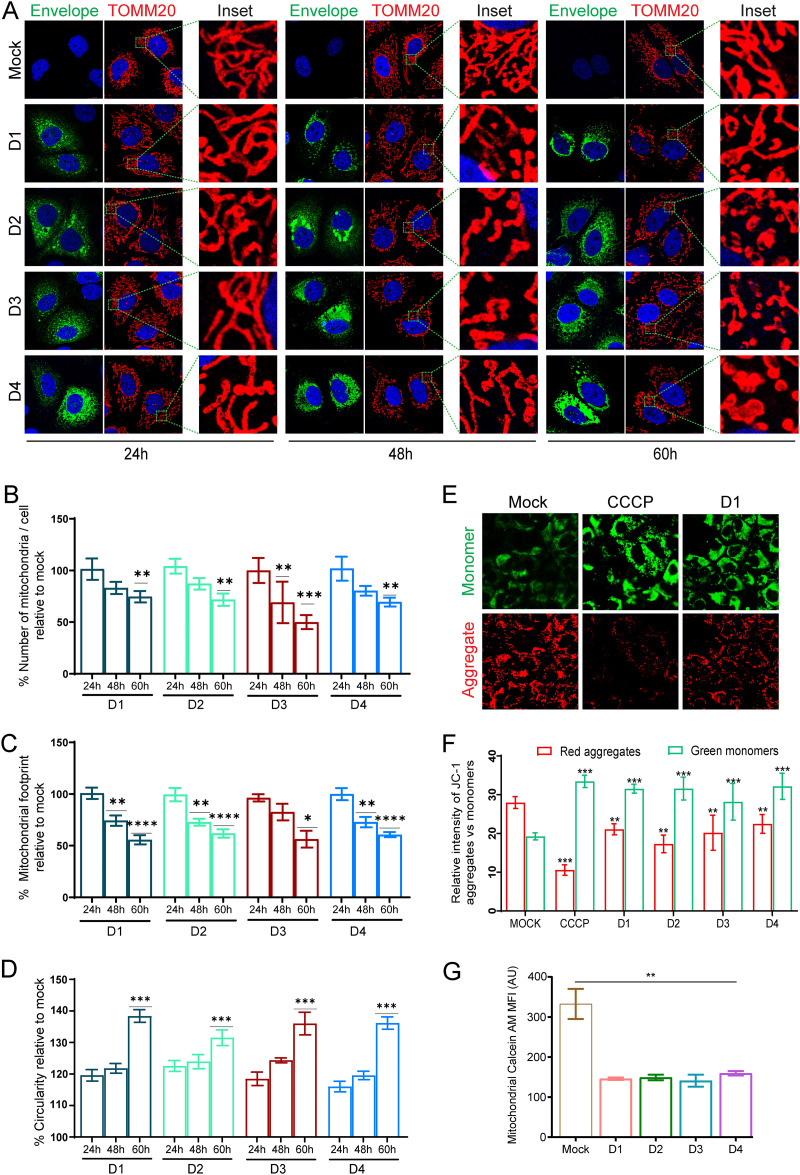
FIG 1.
Dengue infection induces mitochondrial injury in Huh7 cells. (A) Confocal microscopy images of Huh7 cells infected with various dengue virus serotypes at the indicated time points. The cells were immunostained with serotype-specific anti-envelope and mitochondrion-specific anti-TOMM20 antibodies. Nuclei were counterstained with DAPI. Scale bar = 10 μm. Around 30 to 40 cells per condition were quantified for the various features of the mitochondria, such as number, length, and circularity. (B to D) The quantification is depicted as the percentage of mock-infected cells for average mitochondrial number per cell (B), mitochondrial footprint (C), and circularity (D). (E) Fluorescence microscopy images of the dengue serotype 1 (D1)-infected, mock-infected, and CCCP-treated Huh7 cells stained with the mitochondrial membrane potential specific dye JC1. (F) Relative fluorescence intensity of JC-1 aggregates (red) versus monomers (green) in mock-infected, CCCP-treated, and specific dengue serotype-infected Huh7 cells. (G) Graph depicting the status of mitochondrial permeability transition pore (mPTP) opening represented by the mean fluorescence intensity (MFI) of the mitochondrial calcein retained in mitochondria in mock-infected versus dengue serotype-infected cells at 48h postinfection. Data presented are the mean ± standard error of the mean (SEM) of three independent experiments. Statistical analysis was done using one-way ANOVA (B, D, and G) or two-way ANOVA (F). *, P < 0.05; **, P < 0.01; ***, P < 0.001; ****, P < 0.0001.

