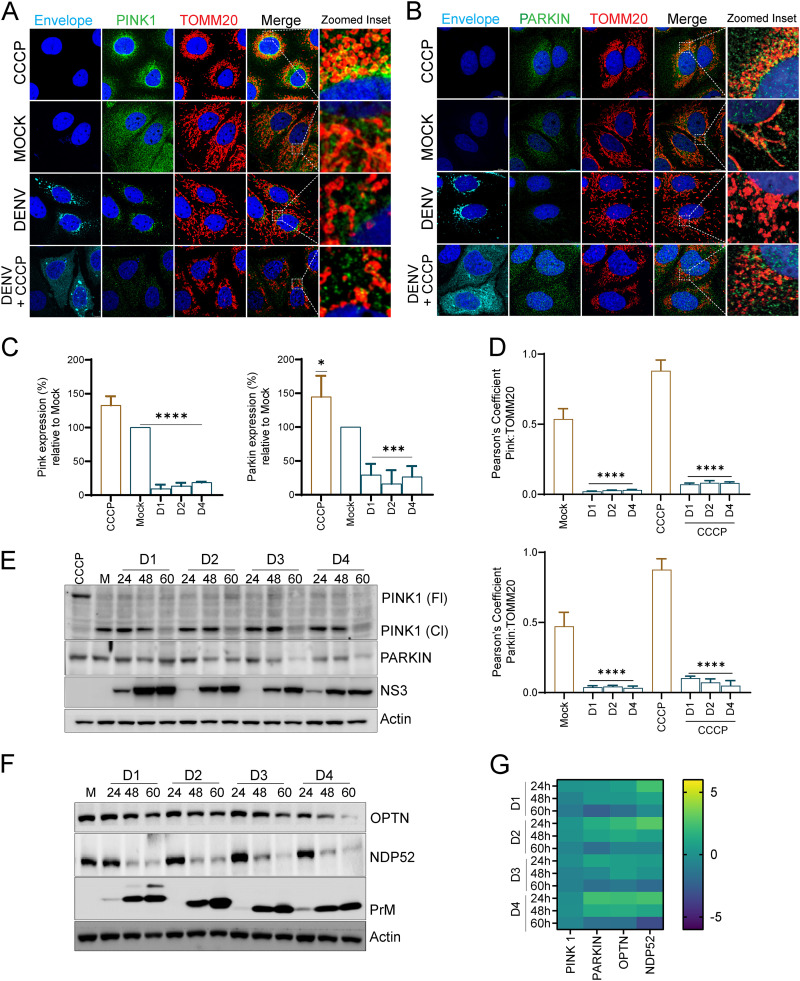
FIG 4.
Dengue inhibits Parkin-mediated mitophagy. (A and B) Confocal images representing mock- or DENV1-infected Huh7 cells at 60 h postinfection were stained for infection (envelope), PINK1, and TOMM20 or stained for infection, Parkin, and TOMM20 as indicated. CCCP-treated Huh7 cells were used as a positive control for induction of mitophagy. Nuclei were counter stained with DAPI. The zoomed inset show regions of colocalization between the green and red channels as yellow spots. (C) Relative quantification of the expression of PINK1 and Parkin in the respective DENV-infected Huh7 cells in comparison to mock-infected and CCCP-treated Huh7 cells. (D) Bar graph depicting the Pearson coefficient of colocalization between PINK1/TOMM20 and Parkin/TOMM20 in the respective DENV-infected Huh7 cells in comparison to mock-infected and CCCP-treated Huh7 cells. (E) Western blot analysis of full length (Fl) and cleaved (Cl) PINK1 and Parkin levels in mock- or DENV-infected Huh7 cells at the indicated times postinfection. CCCP-treatment is used as the positive control for PINK1 activation. NS3 was used as the infection marker, and actin was used as the internal loading control. (F) Western blot analysis of NDP52 and optineurin in mock- or DENV-infected Huh7 cells at the indicated times postinfection. PrM was used as the infection marker, and actin was used as the internal loading control. (G) Heat map representing the transcript level of PINK1, Parkin, NDP52, and optineurin in DENV-infected cells at the indicated times postinfection with respective to mock-infected cells. Data are the mean ± SEM of three independent experiments. Statistical analysis was done by one-way ANOVA. *, P < 0.05; **, P < 0.01; ***, P < 0.001 (E and G).

