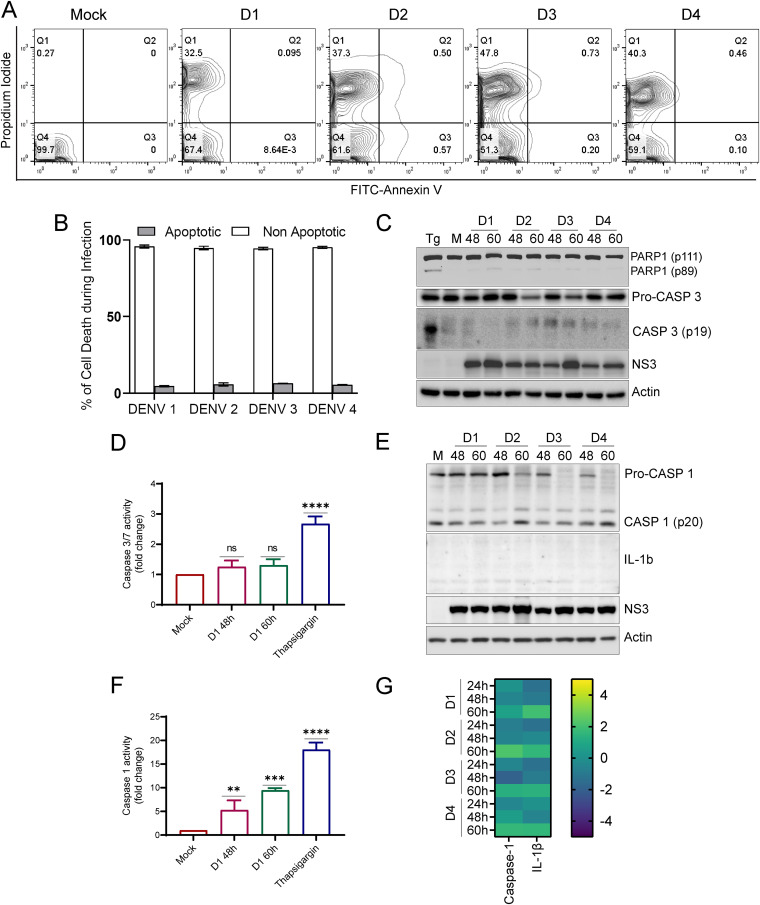
FIG 6.
Dengue infection leads to necrotic cell death in Huh7 cells. (A) Cell death analysis by FACS in mock- and DENV-infected cells at 60 h postinfection. Contour plot showing FACS analysis of mock-infected and infected Huh 7 cells with the x y axes representing annexin V and PI staining, respectively. (B) Bar graph depicting the percentage of cells undergoing apoptotic and nonapoptotic cell death in Huh7 cells infected for 60 h with various serotypes of dengue. (C) Western blot analysis of PARP1 cleavage and caspase 3 activation in mock- and DENV-infected Huh7 cells at the indicated times postinfection. NS3 was used as the infection marker, and actin was used as the internal loading control. (D) Bar graph depicting caspase 3/7 activity in mock- and DENV-infected cells at the indicated times postinfection. The activity is plotted as the fold change with respect to mock-infected cells. (E) Western blot analysis of caspase 1 activation and IL-1β in mock- and DENV-infected Huh7 cells at the indicated times postinfection. NS3 was used as the infection marker, and actin was used as the internal loading control. (F) Bar graph depicting caspase 1 activity in mock- and DENV-infected cells at the indicated times postinfection and represented as the fold change with respect to the mock group. (G) Heat map representing the transcript levels of caspase 1 and IL-1β in infected Huh7 cells with respect to mock-infected cells. The data presented are the mean ± SEM of three independent experiments. Statistical analysis was done by one-way ANOVA. ns, nonsignificant; **, P < 0.01; ***, P < 0.001; ****, P < 0.0001.

