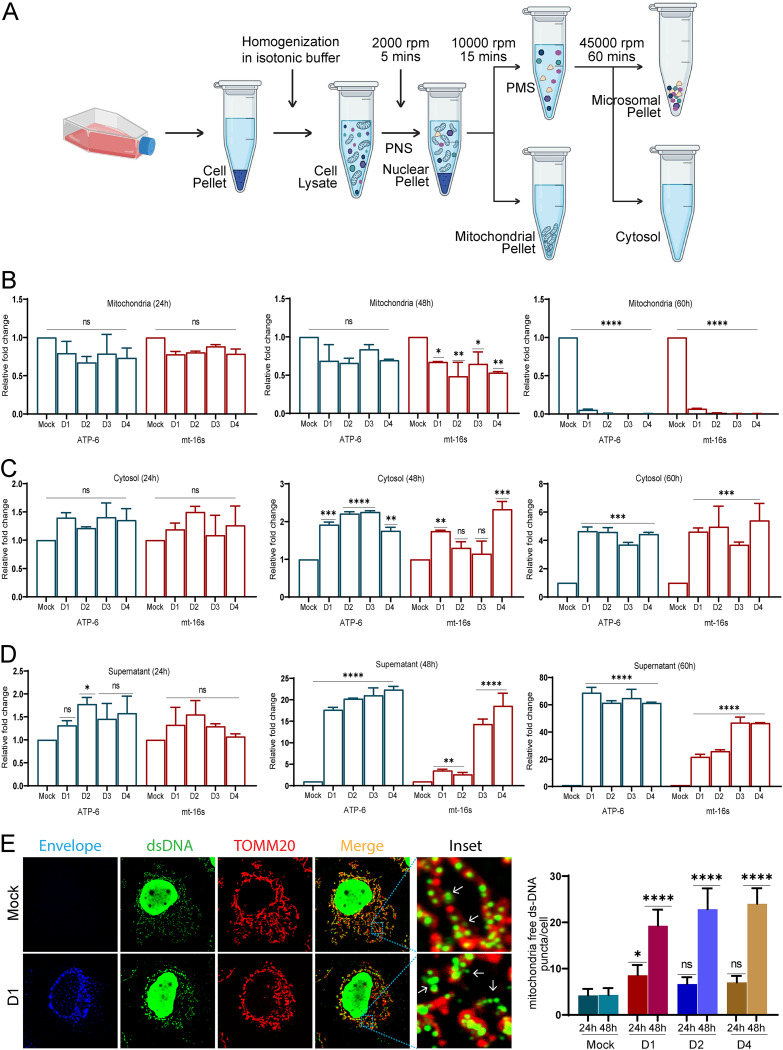
FIG 7.
Dengue virus infection leads to mt-DNA release in Huh7 cells. (A) Work flow illustrating the isolation of mitochondrial and cytosol subcellular fractions through differential centrifugation. (B) mt-DNA isolated from the mitochondrial fractions was subjected to quantitative real-time PCR (qRT-PCR) for mitochondrial ATP-6 and mt-16S RNA. Bar graph depicting their relative levels (fold change with respect to mock infection group) in the mitochondrial fractions obtained from mock- and DENV-infected cells at the indicated times postinfection. (C) mt-DNA isolated from the cytosol fractions of the indicated samples was subjected to qRT-PCR. Bar graph depicting the relative levels (fold change with respect to mock infection group) of ATP6 and mt-16S RNA. (D) mt-DNA isolated from the preclarified cell culture medium of the indicated samples was subjected to qRT-PCR. Bar graph depicting the relative levels (fold change with respect to mock) of ATP6 and mt-16S RNA. (E) Confocal images of mock- and DENV serotype 1 (D1)-infected Huh7 cells 48 h postinfection stained for infection (envelope), dsDNA (green), and TOMM20 (red). The bar graph on the right depicts the quantitation of mitochondrial free dsDNA puncta found in the cytosol of mock-infected and infected cells at 24 h and 48 h postinfection with different serotypes of dengue. Data are the mean ± SEM of three independent experiments. Statistical significance was determined using one-way ANOVA. ns, nonsignificant; *, P < 0.05; **, P < 0.01; ***, P < 0.001; ****, P < 0.0001.

