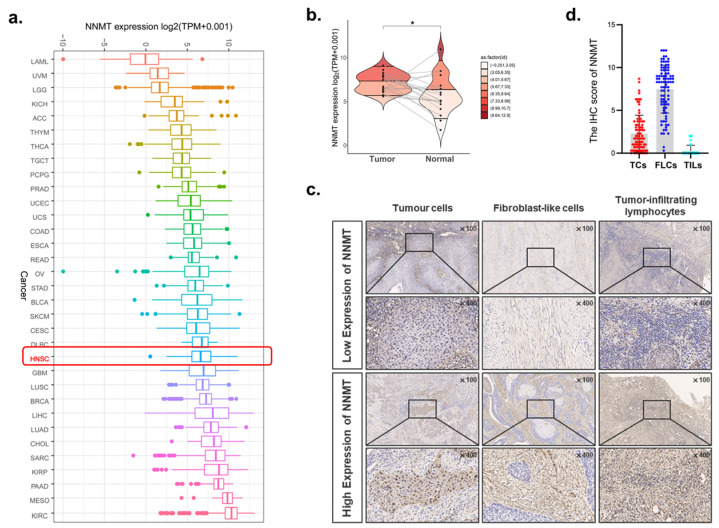
Figure 2.
Expression of NNMT in OSCC and other cancers. (a) The NNMT expression in different tumor types using TCGA database. (b) RNA-seq data from TCGA study showed upregulation of NNMT in OSCC as compared with adjacent normal tissues (paired and unpaired samples, n = 19). (c) Typical IHC staining of NNMT high and low expression in TCs, FLCs and TILs, n = 90. (d) The IHC score of NNMT in TCs, FLCs and TILs from OSCC patients, n = 90. TCs, tumor cells; FLCs, fibroblast-like cells; TILs, tumor-infiltrating lymphocytes. * represents that differences were considered statistically significant with p < 0.05.

