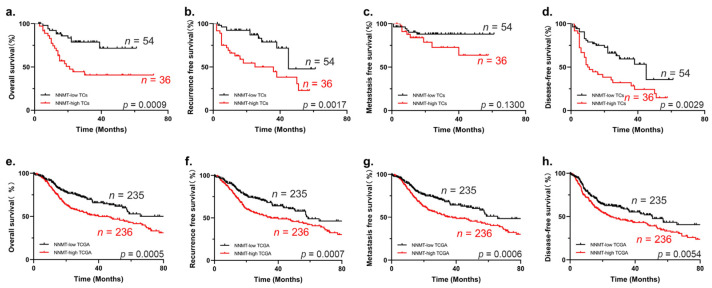
Figure 4.
Kaplan–Meier survival curves for OS, RFS, MFS and DFS of OSCC patients. (a–d) High expression of NNMT has poor OS, RFS and DFS of patients according to our cohort, n = 90. (e–h) High expression of NNMT also has poor OS, RFS, MFS and DFS of patients using TCGA database. OS, overall survival; RFS, recurrence-free survival; MFS, metastasis-free survival; DFS, disease-free survival.

