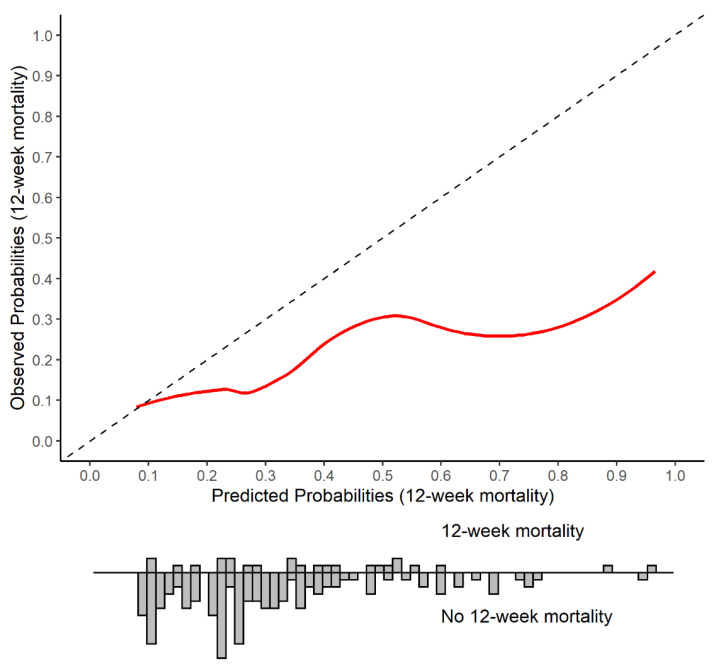
Figure 2.
Calibration plot of the Colon Life nomogram: predicted versus observed 12-week mortality in QUALITAS patients. The Colon Life nomogram predicted 12-week mortality versus the observed 12-week mortality is shown, with the diagonal line indicating performance of a well-calibrated model. The histogram displays the predicted probability distribution for patients who died within 12 weeks of initiating FTD/TPI treatment versus who survived.

