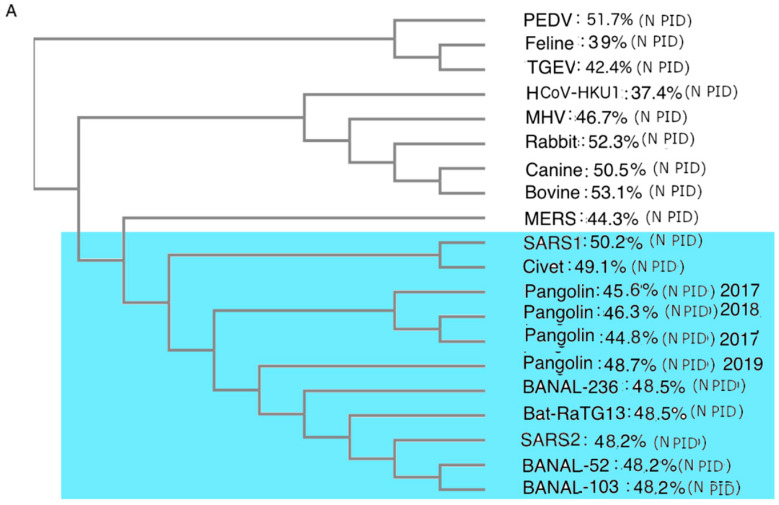
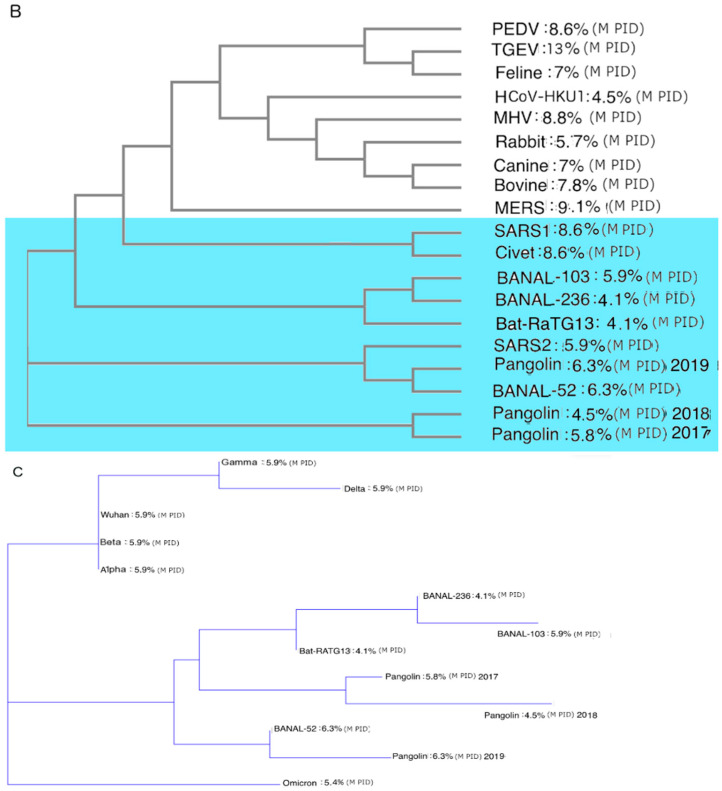
Figure 3.
CoV Phylogenetic Trees with PIDN and PIDM Values. (A) Phylogenetic trees of CoVs using N proteins. Analysis was performed using CLUSTAL OMEGA [78]. (B) Phylogenetic trees of CoVs using M. Analysis was performed using CLUSTAL OMEGA [78]. (C) Phylogenetic trees of COVs related to SARS-CoV-2 using M protein. Analysis was performed using CLUSTALW [79]. Blue region denotes viruses related to SARS-CoV-2.


