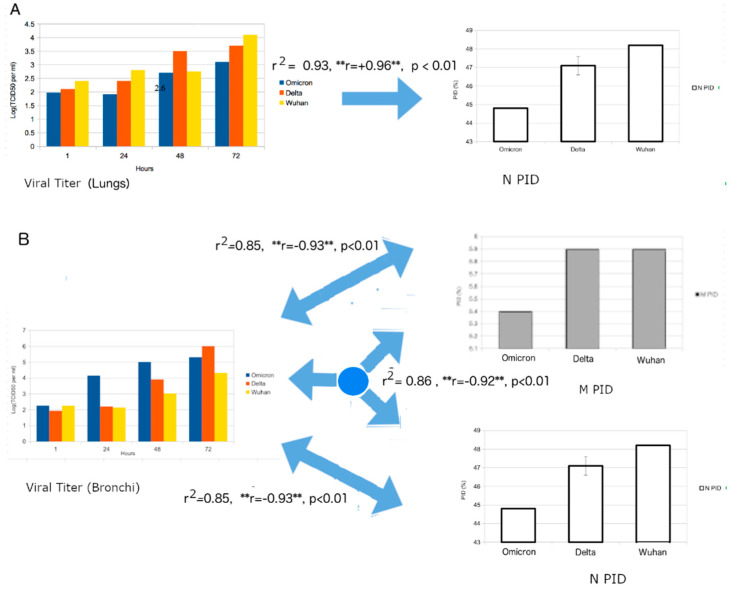
Figure 6.
Regression Analysis of Viral Titer and corresponding PIDN and PIDM values. (A) Strong positive correlation can be seen between the viral titer from human lung tissues and PID. Regression model: VT = A × PIDN) + B × Time + B, where VT = Viral Titer, A,B = Coefficients, C = Y-Intercept. (B). A strong negative correlation is seen between viral titer from human bronchial tissues and PIDN and PIDM values. (Regression model: VT = A × PIDM + B × PIDN + C × Time + D where VT = Viral Titer, A,B,C = Coefficients, D = Y-Intercept.) The figure is a statistical extension of the data from [43] using disorder information. “**” denotes the importance of a negative or positive correlation (r). The significance of this will be revisited in the next subsection.

