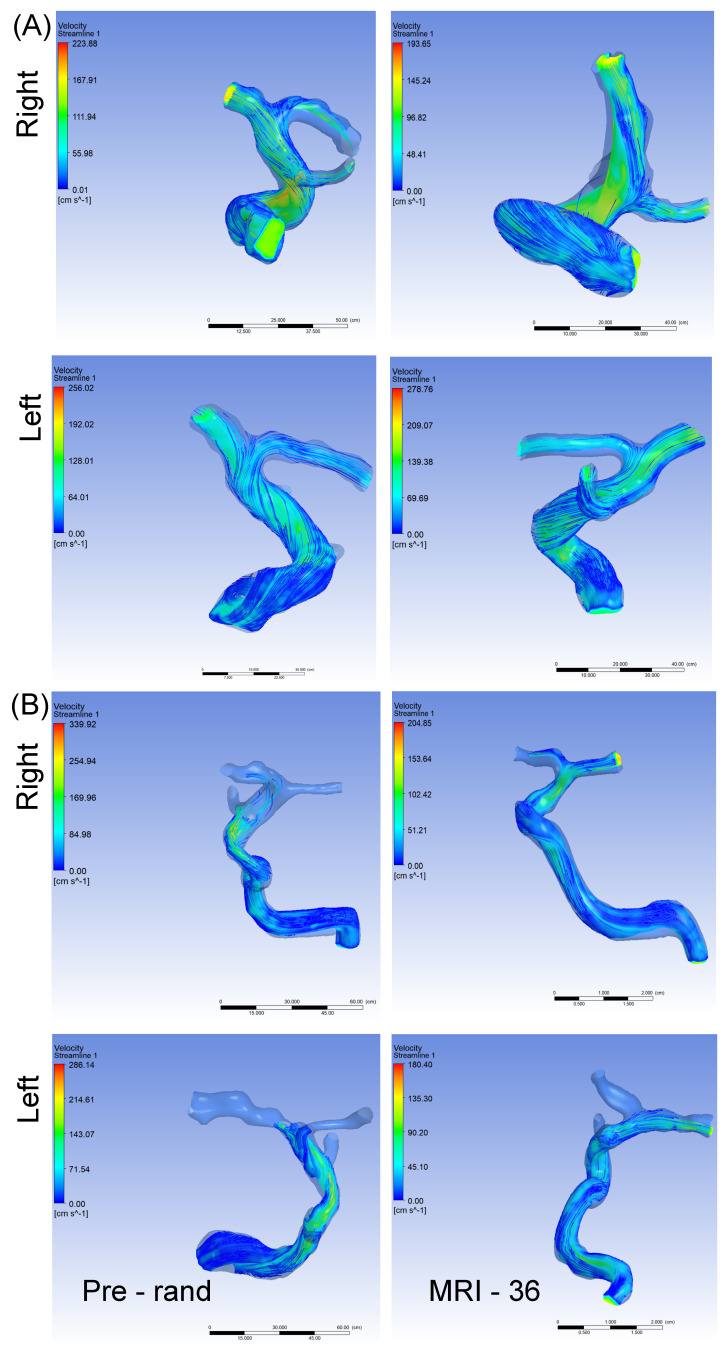
Figure 2.
Panel “(A)” represents velocity in a participant in the observation arm with MRA at pre-randomization and after 36 months. In the right ICA, TAMV decreased from 168 cm/s to 125 cm/s after 36 months, while the left ICA TAMV increased from 114 cm/s pre-randomization to 166 cm/s at 36 months. Panel “(B)” represents velocity in a participant in the cRBC treatment arm with MRA at pre-randomization and after 36 months. In the right ICA, TAMV decreased from 186 cm/s to 154 cm/s after 36 months, while the left ICA TAMV unchanged at 102 cm/s pre-randomization and 105 cm/s at 36 months. cRBC = chronic red blood cell infusion, MRA = magnetic resonance angiography, TAMV = time averaged mean velocity.

