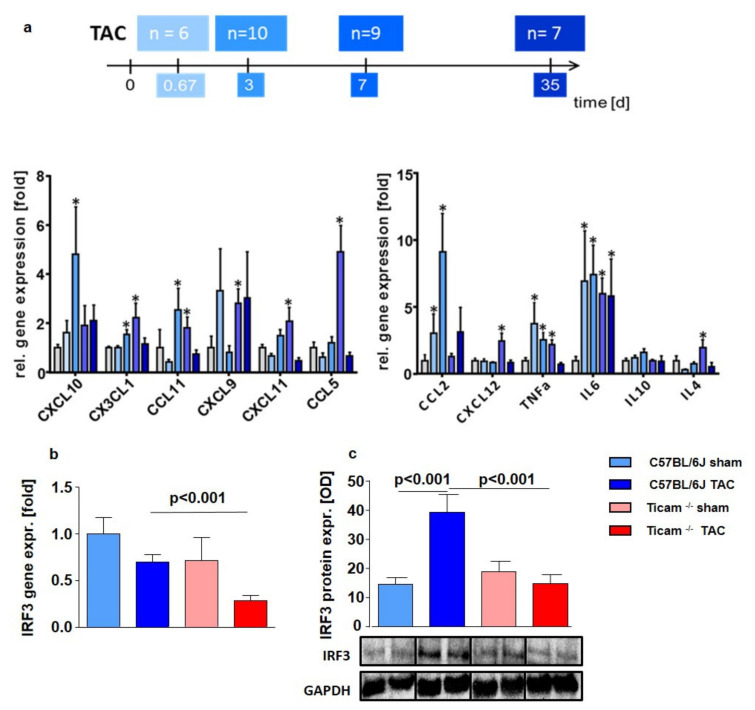
Figure 1.
(a) Maximum gene expression of cytokines 16 h and d 3 after TAC. Relative mRNA Expression in heart tissue of C57BL/6 mice 16 h, d 3, d 7, and d 35 after TAC (n = 6–10; * = p < 0.05) compared to the mean of Sham-operated mice. Downstream IRF3 mRNA (b) and protein expression (c) in heart tissue d7 after TAC, ctrl. vs. TAC (n = 5–8).

