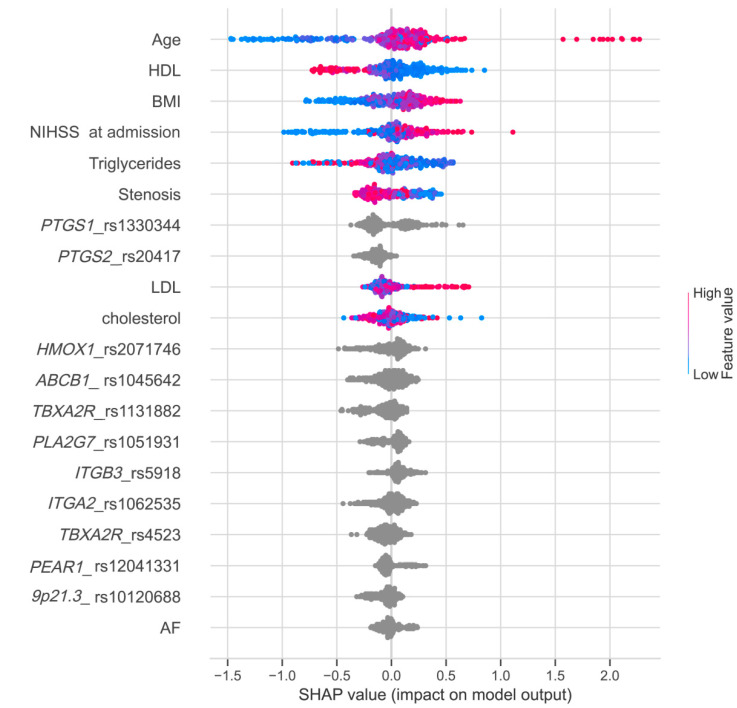
Figure 4.
Feature importance ranking obtained using SHAP values. Variables are listed in order of significance from top to bottom on the y-axis. Each point represents a patient, and its color indicates the value of corresponding variable. The position of the points on the x-axis represents SHAP values, indicating the changes in log odds, and the probability of success can be extracted from this value.

