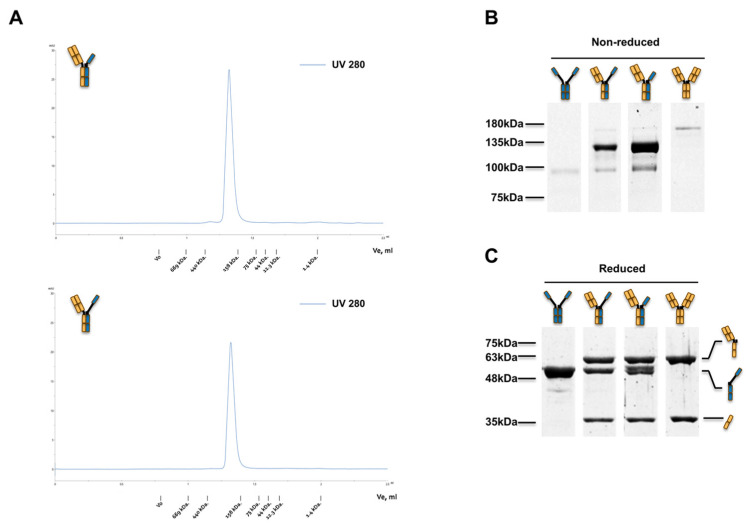
Figure 2.
Analysis of the expressed mCD3E × mEGFR TbsAbs. (A) Size exclusion chromatography (SEC) analysis of TbsAb.long and TbsAb.short proteins. Ten µL of each respective sample (TbsAb.long and TbsAb.short), at 0.5 mg/mL were eluted by DPBS buffer at a flow rate of 50 µL·min−1. (B,C) SDS-PAGE analysis of TbsAb.long and TbsAb.short proteins under non-reducing and reducing conditions, respectively.

