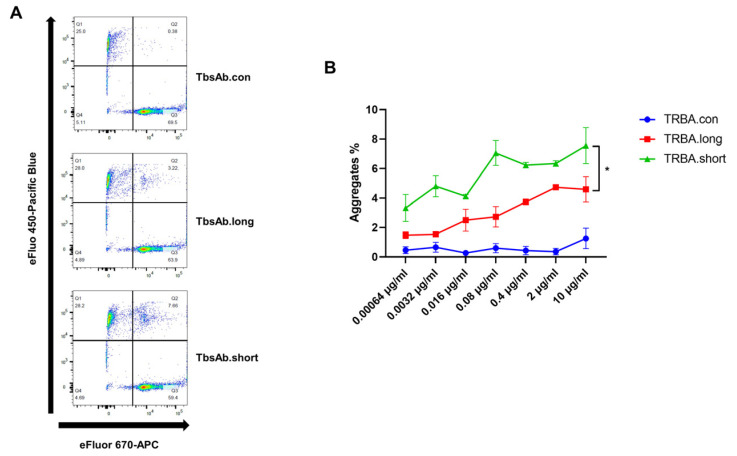
Figure 5.
The TbsAb.short form shows better cell aggregate formation than the TbsAb.long form. OT-1 cells were labeled with eFlour 670 dye, and ID8 cells were labeled with the eFlour 450 dye. (A) Cells were incubated for 30 min at room temperature with TbsAb.con, TbsAb.long or TbsAb.short molecules at 0.672 nM (0.08 μg/mL). The OT-1-ID8 cell-cell association was determined using flow cytometry and quantified as the percentage of eFlour 450 and eFlour 670 double positive cells in the upper right quadrant. (B) The experiment was repeated using increasing concentrations for each of the molecules. Each experimental point was set up in duplicate and the mean SD was plotted. *: p < 0.05.

