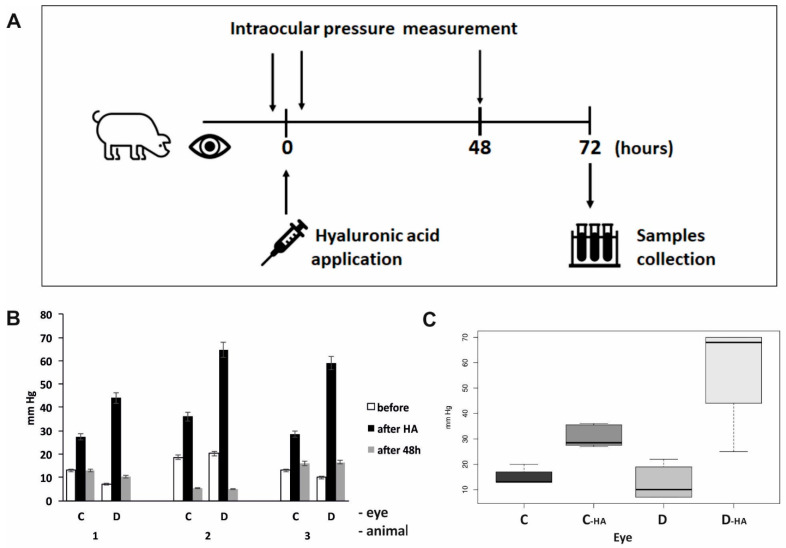
Figure 1.
Monitoring of intraocular pressure during an experiment by iCare tonometer. (A) A simplified time chart of the experimental arrangement; (B) Intraocular pressure values in individual eyes. Means of minimum of six values are shown. HA—hyaluronic acid, C—control left eye, D—right eye after acute intraocular pressure elevation. (C) Differences between the pressure changes were analyzed using a linear mixed-effect model. Analysis was performed in a statistical package R, version 4.2.1. Before hyaluronic acid application, no difference between the control (C, n = 14) and treated eyes (D, n = 17) could be observed (p = 0.6206). Increase in the intraocular pressure during the experiment was significantly higher in treated right eyes (D-HA, n = 18) compared to control left eyes (C-HA, n = 12) (p = 0.0000).

