Figure 5.
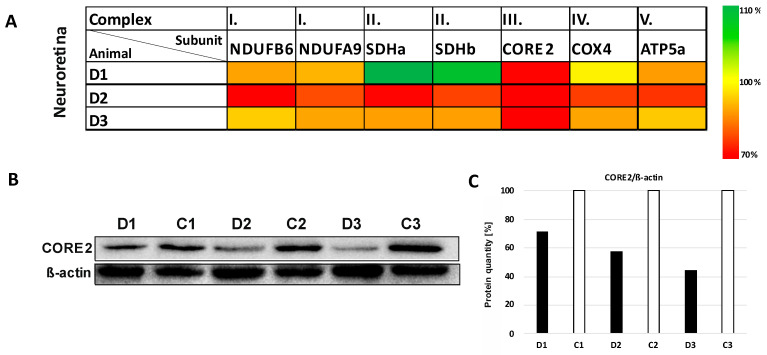
Changes in the protein expression of selected subunits of oxidative phosphorylation system complexes in the neuroretina layer of minipig eyes after high intraocular pressure-induced retinal ischemia. (A) The heatmap shows significant reduction in CORE2 protein (structural subunit of complex III). The results of SDS/WB evaluation were normalized to β-actin and compared to the left eyes of each minipig. D1, D2 and D3 are eyes after high intraocular pressure-induced retinal ischemia. The scale on the right shows the degree of the protein level change. (B) Decreased level of CORE2 was detected in neuroretina compared to the control samples (p < 0.0001). Lysates from homogenates of diseased/retinal ischemia (D1, D2, D3) and control (C1, C2, C3) eyes were analyzed by SDS-PAGE/WB. Briefly, 10 µg of total protein was separated in 12% glycine gel and detected. Representative SDS/WB is shown. (C) Quantification of the Western blot signal (shown in panel (B). The intensity of the bands was quantified by Quantity One software and their values were normalized to β-actin. Further comparisons of groups (control eyes versus eyes after intraocular pressure-induced retinal ischemia) are shown in Supplementary Figure S3.

