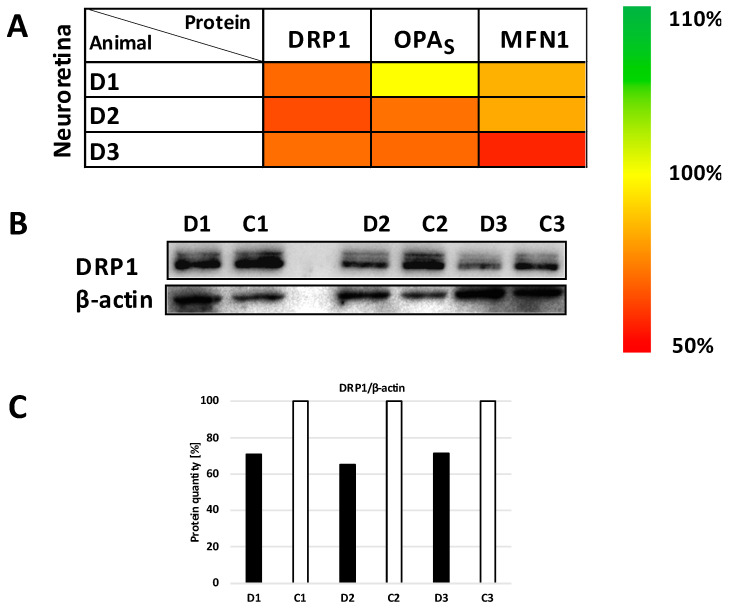
Figure 6.
Changes in mitochondrial quality control proteins content in neuroretina layer of minipig eyes after high intraocular pressure-induced retinal ischemia. (A) The heatmap of Dynamin-related protein 1 (DRP1), short form of optic atrophy (S-OPA) and Mitofusin 1 (MNF1) expression. The results from SDS/WB evaluation were normalized to β-actin and compared to the control eye of each minipig. Scale on the right shows the degree of the expression change. D1, D2 and D3 are eyes after high intraocular pressure-induced retinal ischemia. (B) A decreasing trend of DRP1 protein content after normalization to β-actin was found in neuroretina after intraocular pressure elevation compared to control samples (p < 0.01). Lysates from homogenates of diseased/retinal ischemia (D1, D2, D3) and control (C1, C2, C3) eyes were analyzed by SDS-PAGE. Briefly, 10 µg of total protein was separated in 12% glycine gel and detected. Representative SDS/WB is shown. (C) Quantification of the Western blot signal (shown in panel (B)). The intensity of the bands was quantified by Quantity One software and their values were normalized to β-actin. D1, D2 and D3 are right eyes of minipig 1–3 after high intraocular pressure-induced retinal ischemia; C1, C2 and C3 are left control eyes of each minipig. Further comparisons of groups (control eyes versus eyes after intraocular pressure-induced retinal ischemia) are shown in Supplementary Figure S4.

