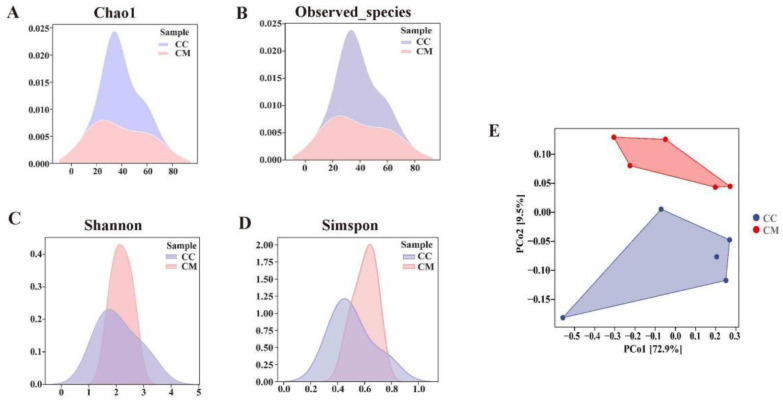
Figure 4.
Analysis of the diversity, richness and microbiota structure of the gut content microbiota. (A) Chao1 index. (B) Observed species index. Larger Chao1 index and the Observed species index indicate higher community richness. (C) Simpson index. (D) Shannon index. Larger Simpson index and the Shannon index indicate a higher community diversity. (E) PCoA analysis. The closer the distance between the two groups on the axes, the more similar the community composition of the two groups in the corresponding dimension. CC, control group (n = 5); CM, model group (n = 5).

