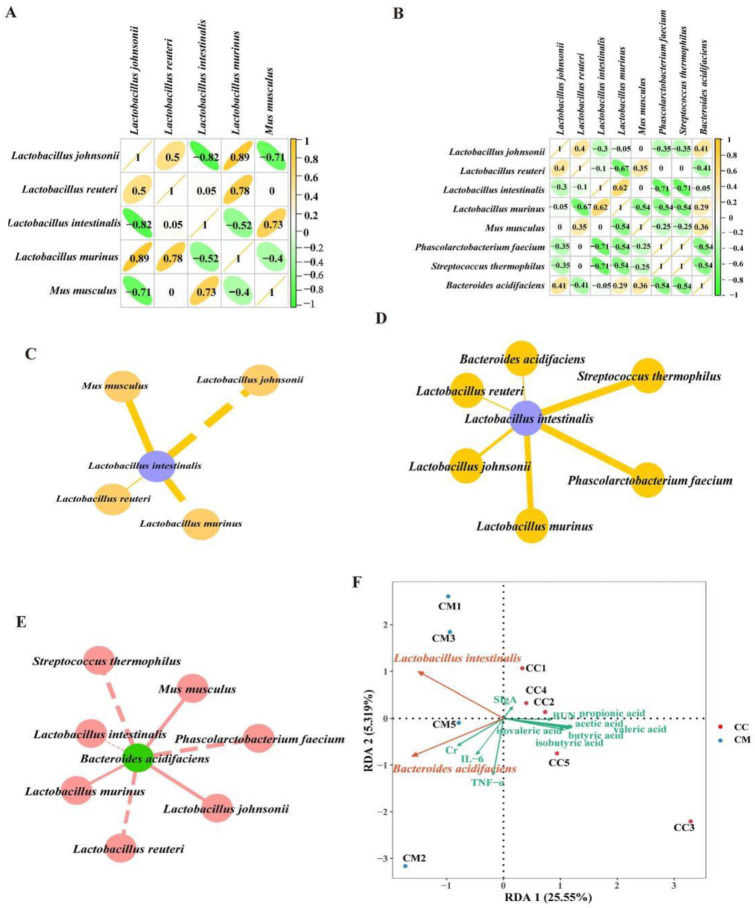
Figure 9.
Correlation coefficient analysis of the characteristic bacteria. (A) Correlation coefficient diagram of the characteristic bacteria at the species level in the CC group. (B) Correlation coefficient diagram of the characteristic bacteria at the species level in the CM group. It presents the correlation coefficients between the characteristic bacteria within each group at the species level, with green circles representing the negative correlations and the yellow circles representing the positive correlations. (C) “Lactobacillus intestinalis-characteristic bacteria” interaction network in the CC group. (D) “Lactobacillus intestinalis-characteristic bacteria” interaction network in the CM group. (E) “Bacteroides acidifaciens-characteristic bacteria” interaction network in the CM group. The solid line represents the positive correlation and the dashed line represents the negative correlation. (F) Association diagram of Lactobacillus intestinalis and the SCFAs. (G) Association diagram of Bacteroides acidifaciens and the SCFAs. (H) RDA. The angle between the connecting arrows represents the correlation, with an acute angle indicating a positive correlation and an obtuse angle indicating a negative correlation. CC, control group (n = 5); CM, model group (n = 5).

