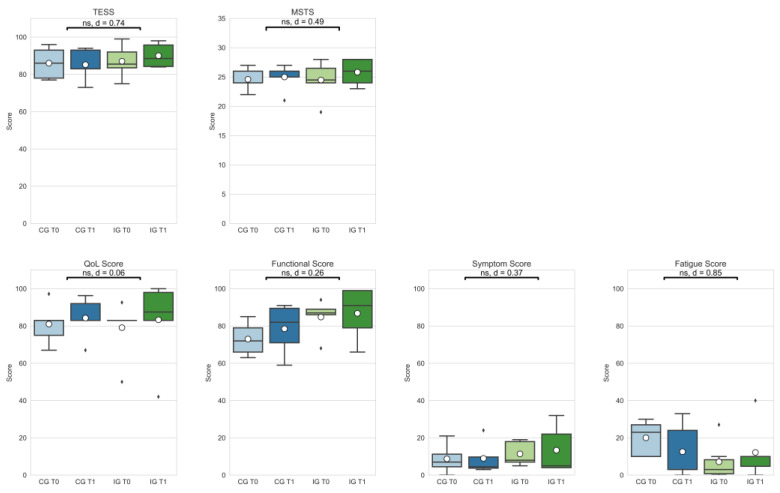
Figure 3.
Patient-reported outcomes (Toronto Extremity Salvage Score (TESS); Musculoskeletal Society Score (MSTS); Quality of Life assessment—Function, Symptom, and Fatigue scores) of the control group at T0 (CG T0, light blue) and T1 (CG T1, dark blue) as well as the intervention group at T0 (IG T0, light green) and T1 (IG T1, dark green). Box-whisker plot showing quartiles, mean (°), and outliers (⬧); statistical annotations showing significance (ns = not significant) and effect size (absolute Cohen’s d); comparison delta changes via independent t-test, α = 0.05.

