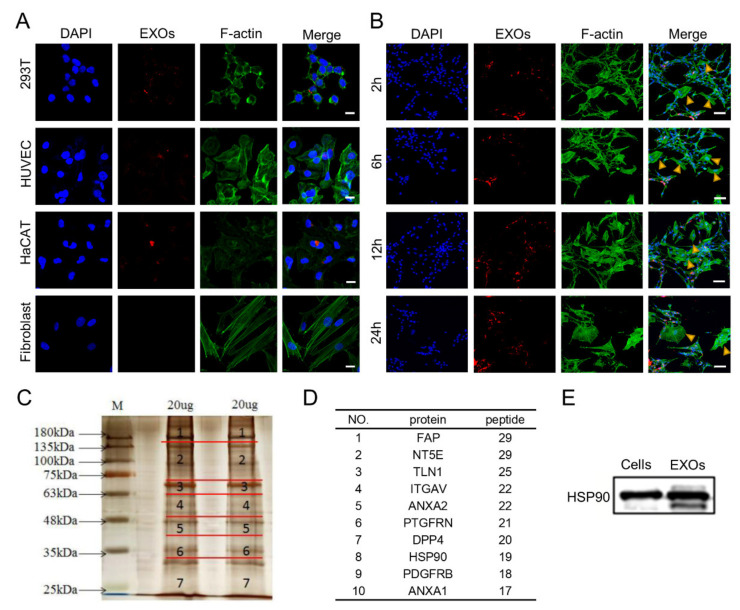
Figure 2.
Internalization and protein analysis of ADSC-EXOs. (A) Confocal images of 293T, HaCAT, HUVECs, and fibroblasts incubated with 20 μg PKH26-labeled ADSC-EXOs for 24 h; scale bar: 20 μm. (B) Confocal images of co-cultured Schwann cells and fibroblasts incubated with PKH26-labeled ADSC-EXOs at different times; scale bar: 100 μm. (C) Silver staining analysis of ADSC-EXOs protein gels. (D) Illustration of the top ten high-abundance surface proteins in ADSC-EXOs. (E) Western blot analysis of HSP90 levels in ADSCs and ADSC-EXOs.

