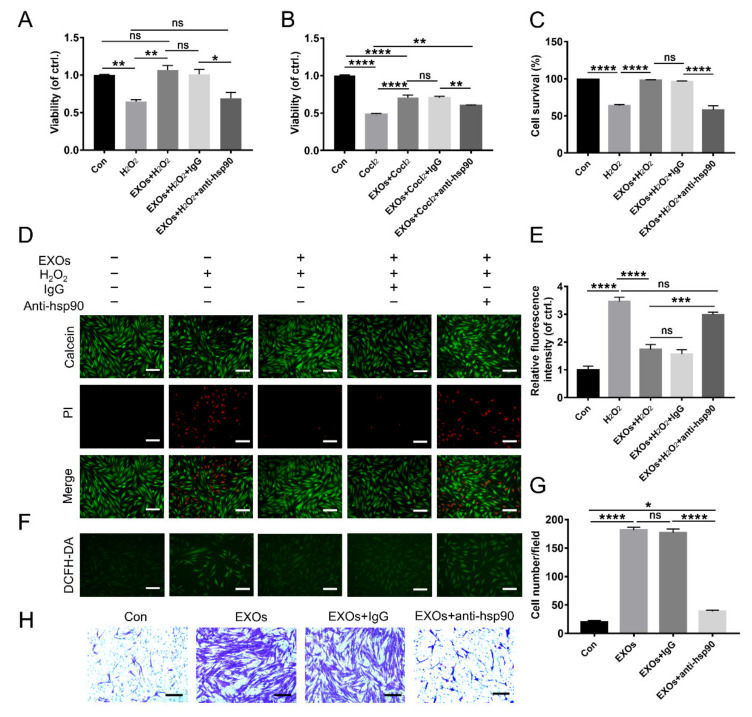
Figure 3.
An anti-HSP90 antibody antagonized the beneficial effect of ADSC-EXOs. ADSC-EXOs were pre-incubated with PBS, IgG, and an anti-HSP90 antibody for 30 min at 37 °C and then used in the following assays. (A) CCK8 analysis of the cell viability of fibroblasts under H2O2 exposure in each group. (B) CCK8 analysis of the cell viability of fibroblasts under CoCl2 exposure in each group. (C) Quantitative analysis of the data in (D). (D) Evaluation of the cell viability by Calcein-AM/PI staining; the green color represents survival cells, and the red color represents dead cells. (E) Quantitative analysis of the relative fluorescence intensity in (F). (F) Representative DCFH fluorescent images of fibroblasts in each group. (G) Quantitative analysis of the data in (H). (H) Representative micrographs of migratory fibroblasts in each group. n = 5. Scale bar: 100 μm. ns p > 0.05, * p < 0.05, ** p < 0.01, *** p < 0.001, **** p < 0.0001.

