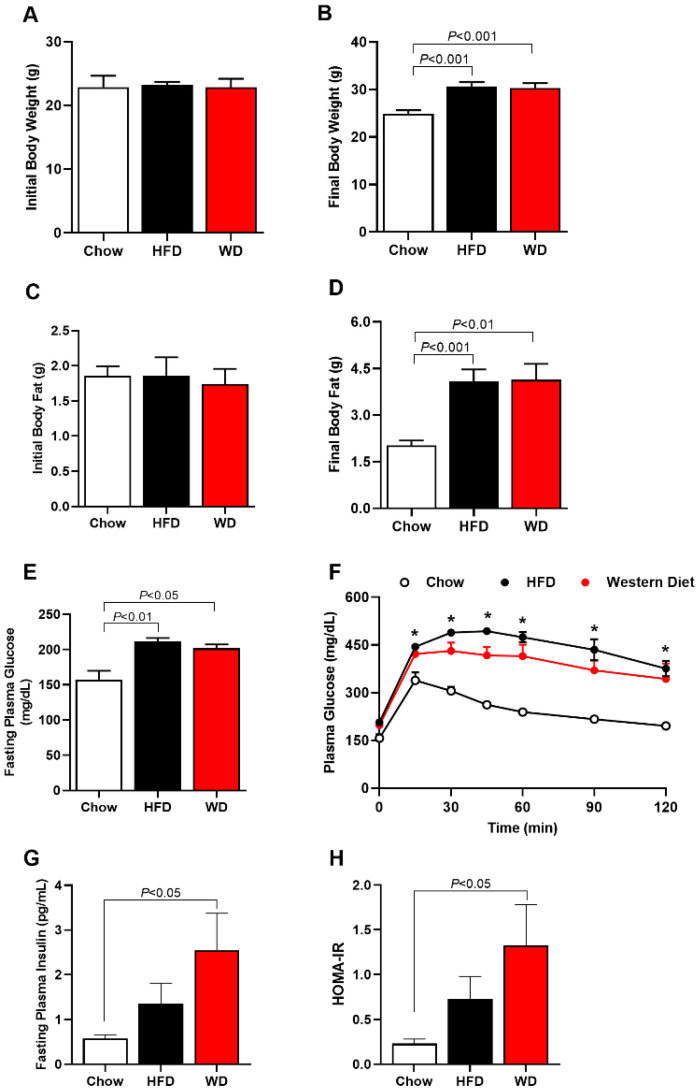
Figure 1.
ApoE KO Mice fed an HFD or WD displayed increased body weight, body fat, fasting plasma glucose, plasma insulin and glucose intolerance. Initial body weight (before diet) (A); final body weight (after 7 weeks of HFD or WD) (B). Initial body fat (before diet) (C); final body fat (after 7 weeks of HFD or WD) (D); fasting plasma glucose (E). Area under curve (AUC) of plasma glucose at different times (F). Fasting plasma insulin (G). Homeostasis model assessment of insulin resistance (HOMA-IR) (H). Data are represented as mean ± SEM (N = 5–9). The statistical differences as indicated by one-way ANOVA were as follows: * p < 0.05 represents the difference between Chow (regular diet) vs. HFD; Chow (regular diet) vs. WD.

