Figure 2.
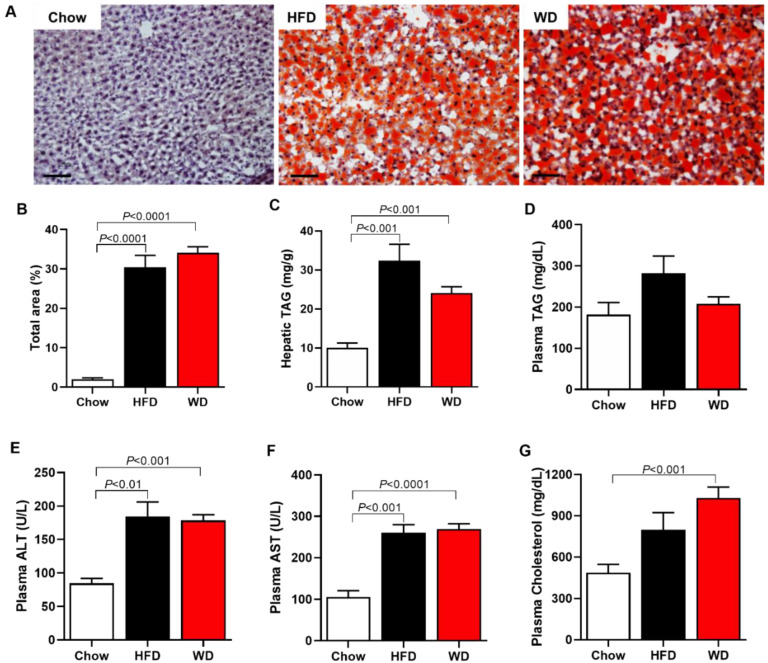
ApoE KO Mice fed an HFD or WD displayed increased liver triglycerides, hepatic enzymes (ALT and AST), plasma cholesterol and lipid droplets. Representative imagens of lipid droplets in the liver, oil red staining (scale of 100 μm, objective 20×) (A). Total area of lipid droplet (B). Hepatic triglycerides (TAG) (C). Plasma triglycerides (TAG) (D). Plasma alanine aminotransferase (ALT) (E). Plasma aspartate aminotransferase (AST) (F). Plasma cholesterol (G). Data are represented as mean ± SEM (N = 5–9). The statistical differences as indicated by one-way ANOVA.

