Figure 4.
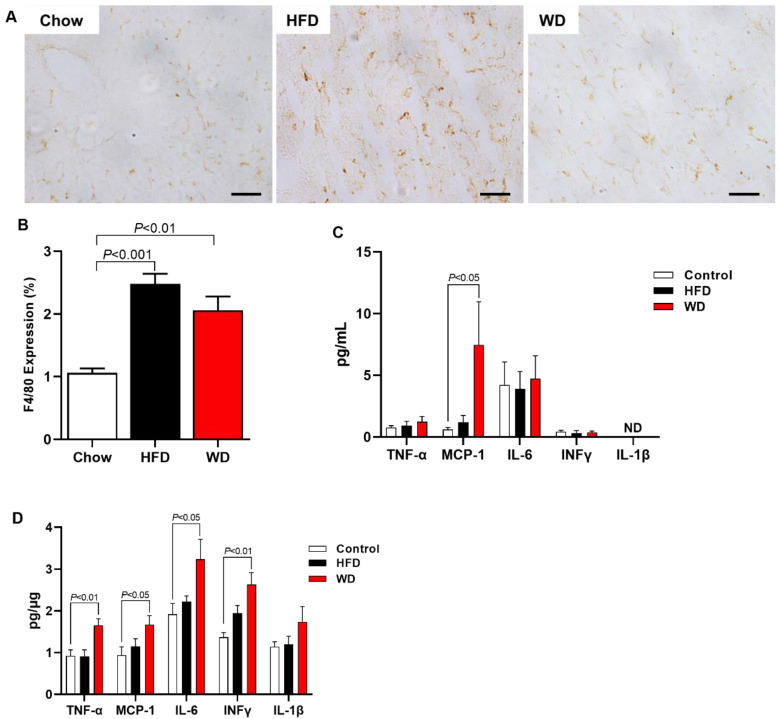
ApoE KO Mice fed an HFD or WD displayed increased hepatic inflammation. Representative images of F4/80 expression (scale of 50 μm, objective 40×) (A). Hepatic inflammation represented for F4/80 expression (macrophage activity marker) (B). Plasma cytokine level (C). Hepatic cytokine level (D). Data are represented as mean ± SEM (N = 5–9). The statistical differences as indicated by one-way ANOVA.

