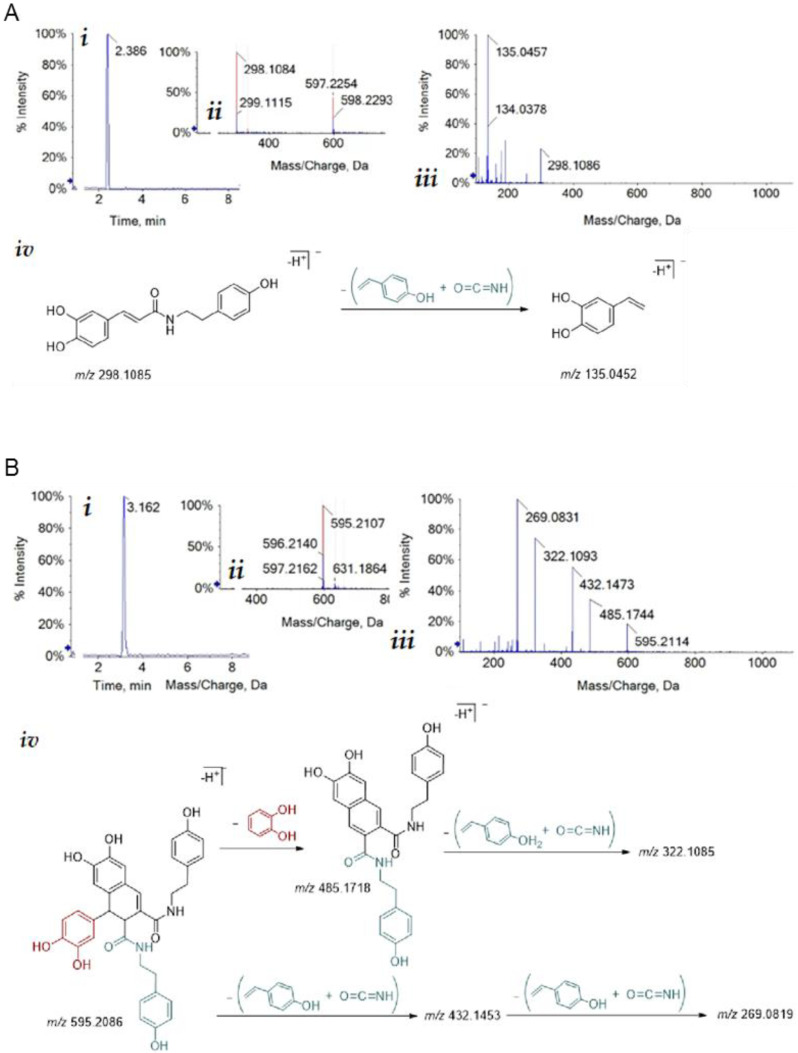
Figure 2.
Structural characterization of hemp seed metabolites by mass spectrometry. (A) N-trans-caffeoyltyramine (i) Total Ion Chromatogram (TIC); (ii) TOF-MS spectrum showing the [M-H]- and [2M-H]- ions at m/z 298.1084 and 597.2254, respectively; (iii) TOF-MS/MS of the [M-H]- ion; (iv) proposed fragmentation pattern; theoretical m/z value is below each chemical structure. (B) Cannabisin B (i) Total Ion Chromatogram (TIC); (ii) TOF-MS spectrum showing the [M-H]- ion at m/z 595.2107; (iii) TOF-MS/MS of the [M-H]- ion; (iv) proposed fragmentation pattern; theoretical m/z value is below each chemical structure.

