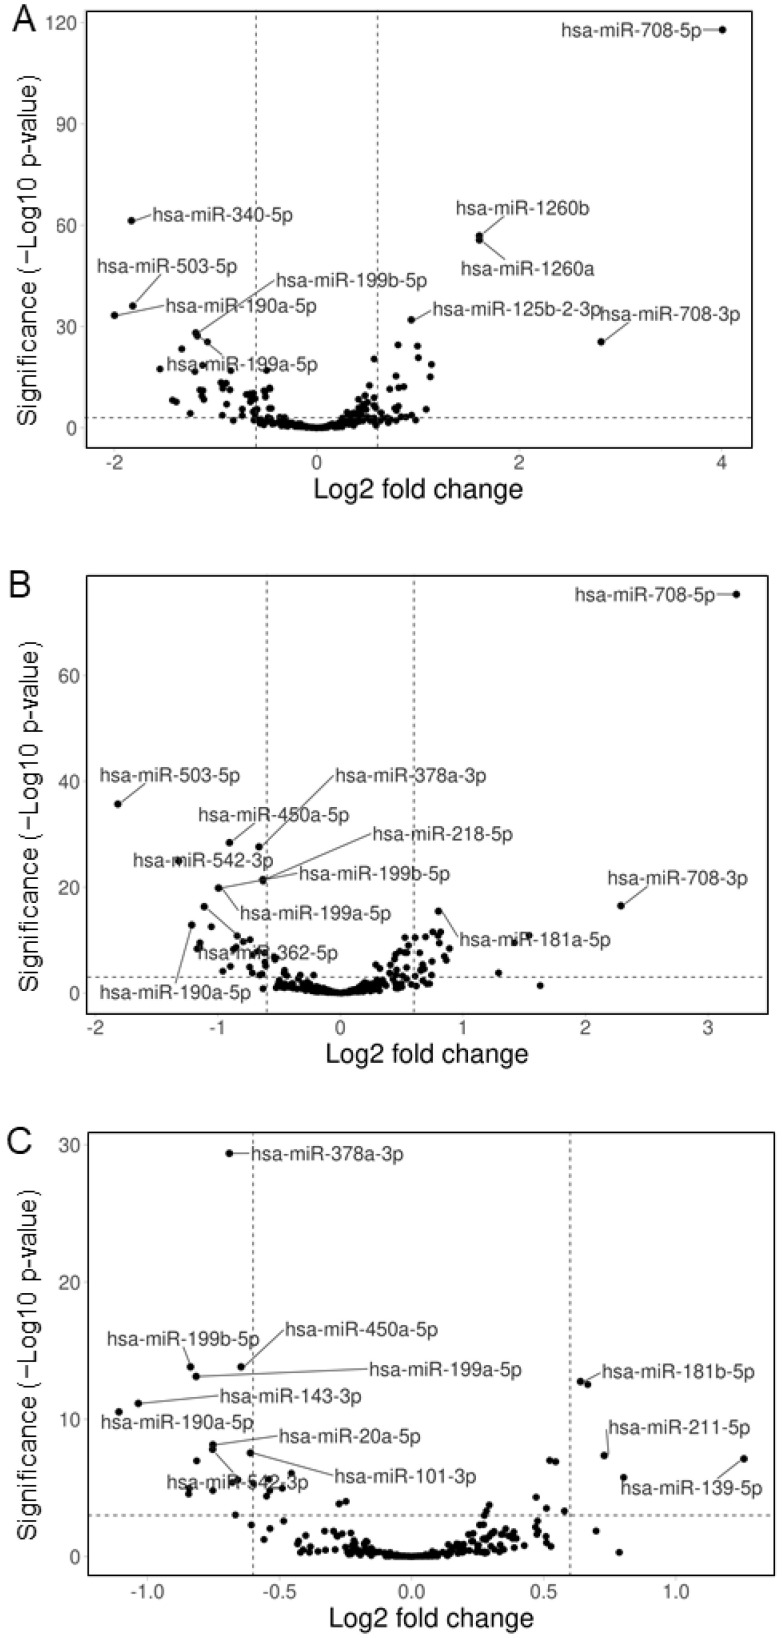
Figure 4.
Volcano plots of microRNA expression changes in cultured neural cells. SH cells were treated with cannabisin B (A), N-trans-caffeoyltyramine (B), or cannabidiolic acid (C) for 48 h, then microRNA expression changes were detected by next-generation small RNA sequencing. Plots were prepared by the program VolcaNoseR [27]. Fields outside the vertical broken lines include miRNAs showing a fold change > 1.5; fields above the horizontal broken line contain miRNAs with a highly significant variation (p < 0.001); hsa, homo sapiens.

