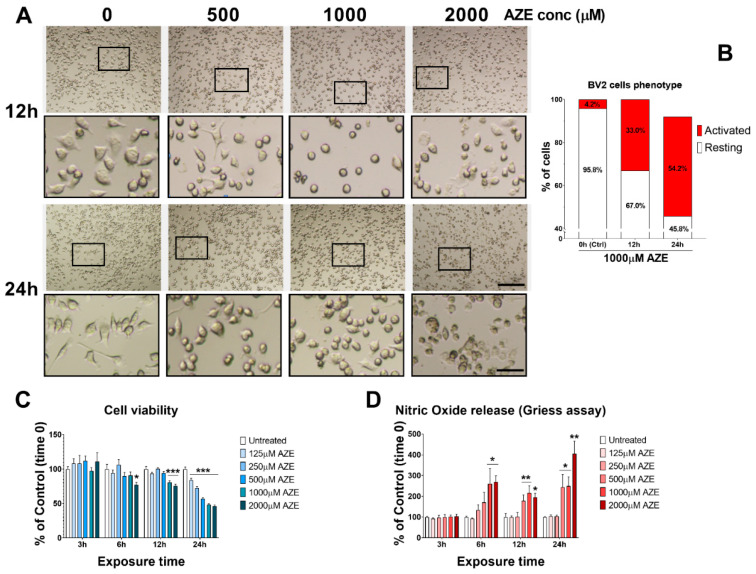
Figure 1.
Dose–response effects of AZE exposure on BV2 microglial cell viability and inflammatory response. (A) Morphological changes seen in microglial BV2 cells following various AZE concentrations (0, 500, 1000, 2000 μM) after 12 and 24 h. Representative photomicrographs were taken using a bright field microscope with the embossing filter settings. Magnification = 10×, scale bar = 200 μm. Black squares indicate the ROI shown at higher magnification in insets. Insets below each photomicrograph show high magnification details of cellular morphology. Magnification = 40×, scale bar = 50 μm. (B) Phenotypic presentation of BV2 cells (Activated vs. Resting). % of cells of each phenotype was determined by counting the # of cells that showed signs of activation (flat and swollen) vs. the total number of cells per region of interest (ROI) and expressed as a percentage (n = 5 ROI × 3 batches of cells). (C) Cell viability, measured by MTT assay. Cells were treated with varying AZE concentrations (0, 125, 250, 500, 1000, 2000 µM) for 3, 6, 12 or 24 h. * p < 0.05 or *** p < 0.001, as determined by ANOVA followed by Dunnett’s post hoc test. (D) Nitric oxide release, assessed using the Griess assay. Cells were treated as in C and NO levels were measured in culture media. Values are reported as the percentage NO release of untreated controls. Data reported as mean ± SEM. * p < 0.05, ** p < 0.01, as determined by ANOVA followed by Dunnett’s post hoc test.

