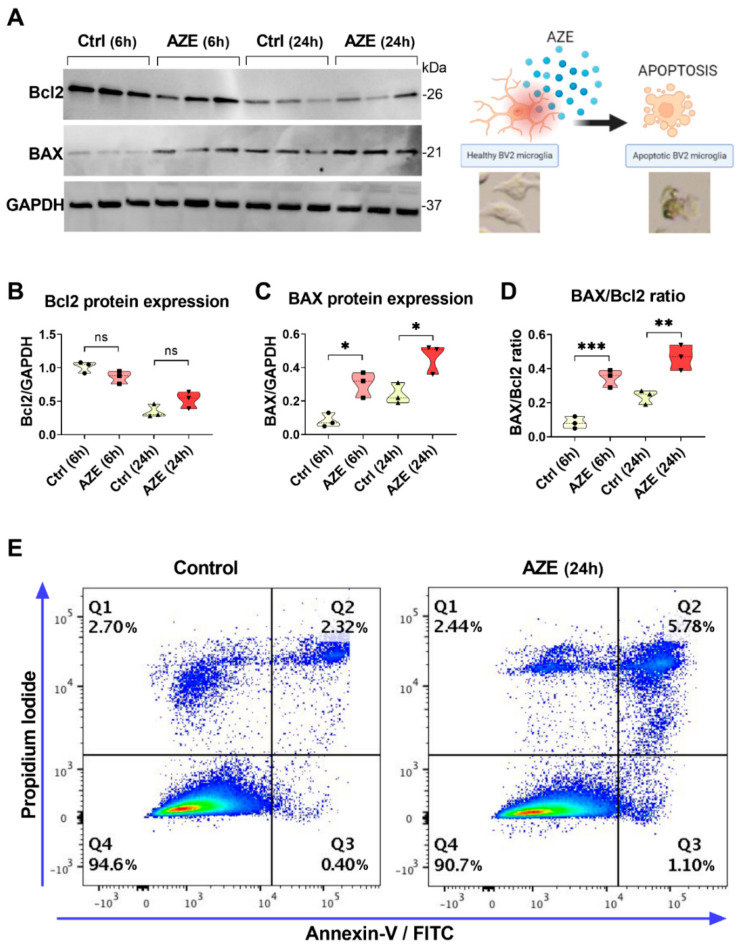
Figure 2.
(A) Representative Western blots showing Bcl2 and BAX protein expression in BV2 cells cultured in the presence or not of AZE (1000 µM) for 6 or 24 h. GAPDH was used as loading control. (B–D) Violin plots depicting results from densitometric analyses of Bcl2 and BAX blots as well as BAX/Bcl2 ratios. Results shown are the mean ± SEM of two independent determinations, each run in triplicate. Ns = not significant. * p < 0.05, ** p < 0.01 or *** p < 0.001 vs. Ctrl at the corresponding time point, as determined by ANOVA and Sidak’s post hoc test. (E) The incidence of apoptotic cells was examined by flow cytometry using Annexin V-FITC/PI staining. The experiment was repeated twice with overlapping results.

