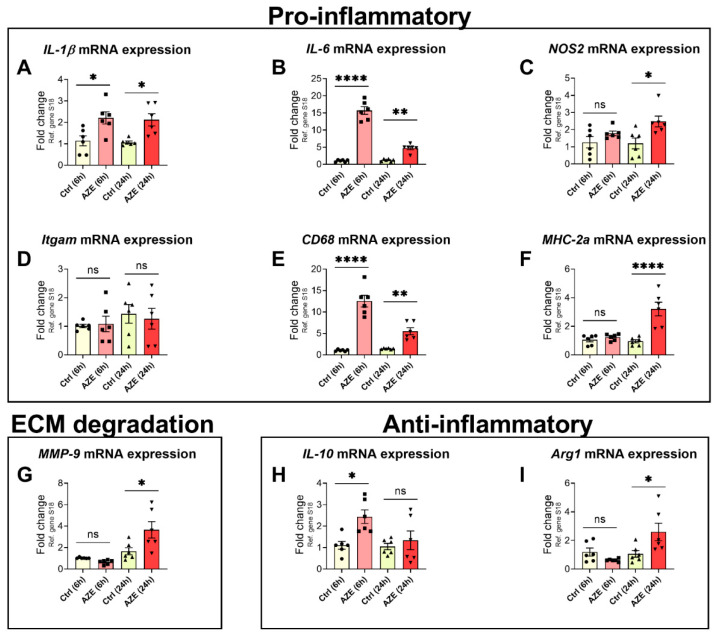
Figure 3.
Gene expression of a panel of pro- and anti-inflammatory genes in BV2 microglial cells after 1000 µM AZE treatment for 6 and 24 h. Relative fold-changes were calculated using the ΔCt method after normalization to the S18 housekeeping gene. Box-and-whisker plots depict the differential expression of pro-inflammatory (A–F) IL-1β, IL-6, NOS2, Itgam, CD68 and MHC-2a, (G) extracellular matrix (ECM) degradation (MMP-9) and (H–I) anti-inflammatory IL-10 and Arg1 transcripts. Results are presented as mean fold changes with respect to no treatment (Ctrl) ± SEM. Data represents n = 6 samples per group. * p < 0.05, ** p < 0.01 or **** p < 0.0001; as determined by ANOVA followed by Sidak’s post hoc test. Ns = not significant.

