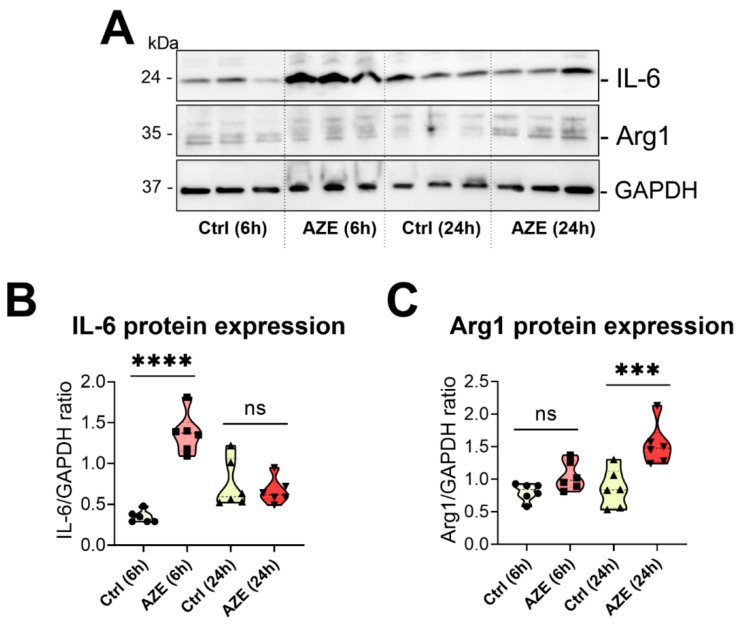
Figure 4.
(A) Representative Western blots showing the protein expression of IL-6 and Arg1 in BV2 cells cultured or not in the presence of AZE (1000 µM) for 6 or 24 h. (B,C) Violin plots of bands densities demonstrating the effects of AZE on the expression of IL-6 and Arg1 at the indicated times. Data reported is the mean ± SEM, from two independent experiments using separate batches of cells (n = 6). GAPDH was used as loading control. Ns = not significant. *** p < 0.001 or **** p < 0.0001 vs. Ctrl at the indicated time, as determined by ANOVA followed by Sidak’s post hoc test.

