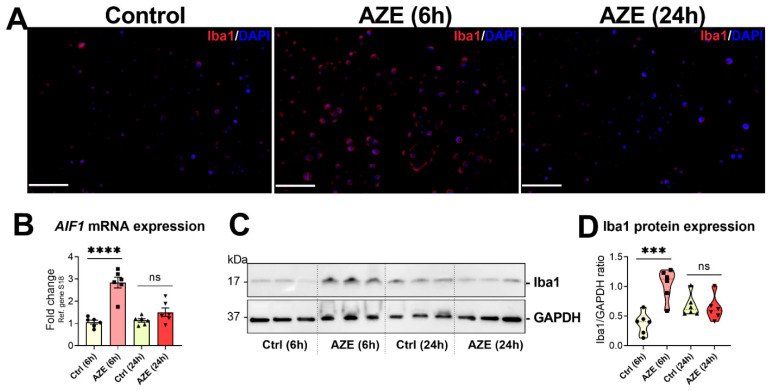
Figure 5.
AZE treatment induces AIF1/Iba1 expression in BV2 cells. (A) Representative photomicrographs of Iba1+ staining in the BV2 microglial cell line. Cells were either left untreated or treated with AZE as indicated and then processed for immunocytochemistry (ICC) as detailed in Section 2. Red = Iba1+ cells (Alexa Fluor 594). DAPI = nuclei. Scale bar = 50 µm. (B) AIF1 gene expression, as determined by real-time qPCR. Fold changes were calculated using the ΔCt method, with baseline expression set to 1. Data is the mean ± SEM (n = 6). **** p < 0.0001 vs. Ctrl at the indicated time points. (C,D) Western blot analyses of Iba protein expression and densitometric analyses of blots. Data reported is the mean ± SEM, from two independent experiments using separate batches of cells (n = 6). GAPDH was used as loading control. Ns = not significant. *** p < 0.001 or **** p < 0.0001 vs. Ctrl at the indicated time, as determined by ANOVA followed by Sidak’s post hoc test.

