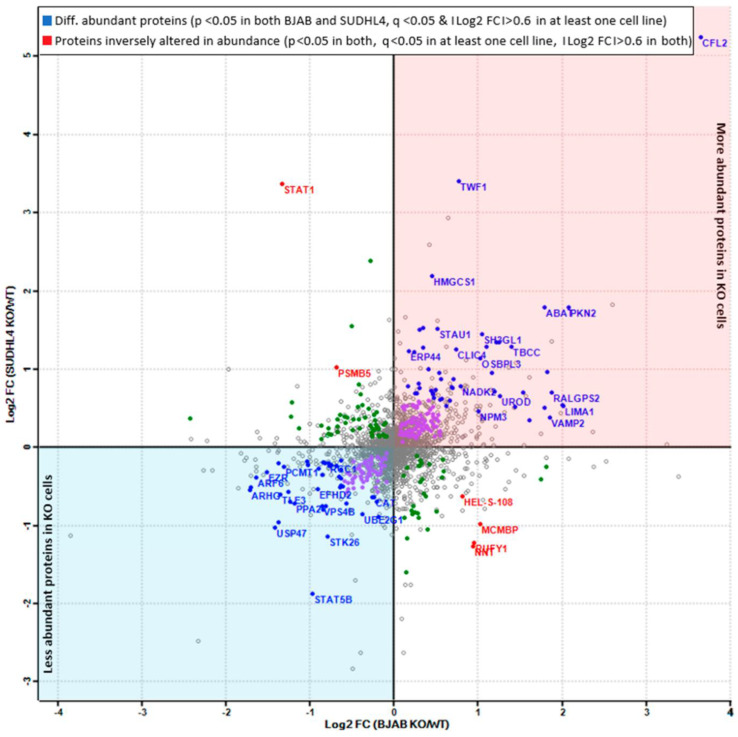
Figure 6.
The scatter plot analysis displays the overlaps in more and less abundant protein groups in both cell lines. Filtering and overlap detection were performed upon a non-paired Student’s T-test, based on the following criteria: p-value < 0.05 for the same entry in both cell lines, q-value (i.e., FDR corrected p-value) <0.05 for the same entry in at least one of both cell lines, and |Log2FC| > 0.6 in both cell lines.

