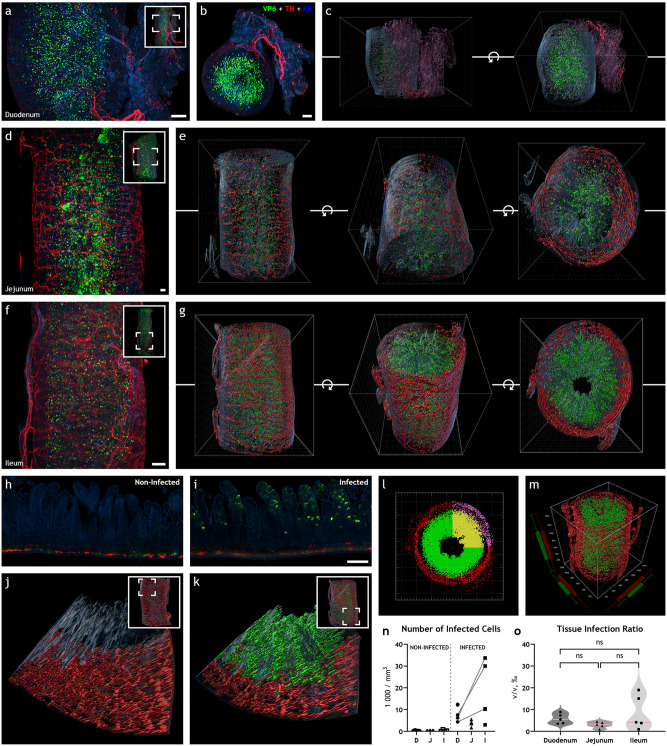
FIG 1.
Rotavirus infection is widespread throughout the length of the small intestine at 16 h postinfection. (a, b, d, and f) Maximum-intensity projection of light-sheet micrograph stacks from rotavirus-infected mouse duodenum (a, b), jejunum (d), and ileum (f) stained for rotavirus VP6 (green) and tyrosine hydroxylase TH (red), the rate-limiting enzyme in catecholamine biosynthesis. Tissue was visualized with autofluorescence (AF; blue). Insets show low-power micrographs denoting enlarged regions in the panel with a box. (c, e, and g) Three-dimensional surface reconstruction from panels a, b, d, and f are shown, respectively. Rotation along the z-axis is denoted by the circular arrow symbol. Note the high degree of rotavirus infection in all segments of the small intestine in panels a to g. (h to j) Single optical slice (h, i) and surface 3D reconstruction (j, k) of infected (i, k) and noninfected (h, j) ileum. (l, m) Imaris vantage plots from infected ileum in panel e depicting the special distribution of the reconstructed 3D model in panel g. Note the regions used for analysis marked with yellow and purple, excluding, for example, incoming axon bundles. (n, o) Rotavirus infection was quantified by counting the number of infected cells (n) or calculating the tissue infection ratio (o). Data points from the same animal are connected with a line. The two-tailed paired t test yielded no significant difference between duodenum and ileum in the number of infected cells in panel n (P = 0.1026) or tissue infection ratio in panel o (P = 0.1826). No significant differences could be seen in tissue infection ratio (o) between jejunum and duodenum (ns; P = 0.0506) or ileum (ns; P = 0.1589) with the two-tailed unpaired t test. D, duodenum; J, jejunum; I, ileum. Scale bar in panels a, b, d, and f, 50 μm, and scale bar in panels h and i, 100 μm.

