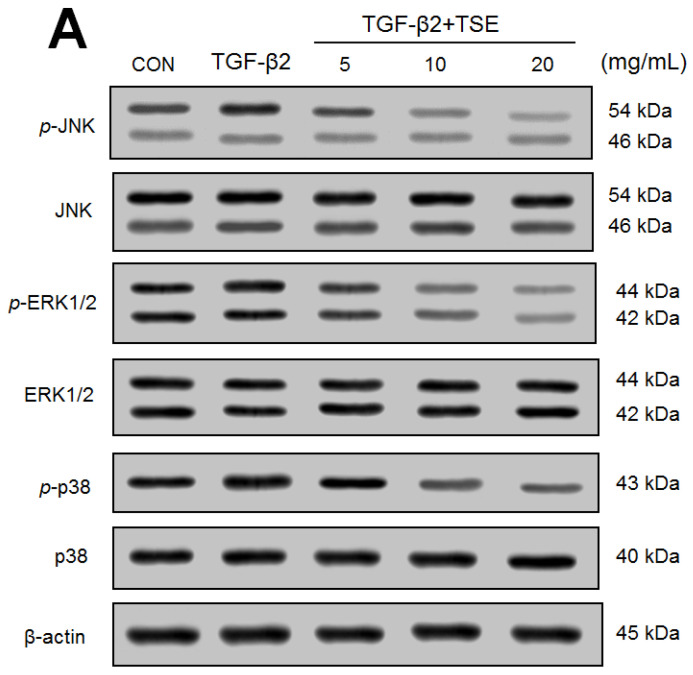
Figure 7.
Effects of TSE on expression levels of p- JUN/ JUN, p-ERK1/2/ ERK1/2, p-p38/ p38, p-PI3K/ PI3K, p-mTOR/ mTOR, p-Akt (Ser473)/ t-Akt, and p-Akt (Thr308)/ t-Akt in SRA01/04 cells by Western blot. (A) representative image, and (B) quantification of the p- JUN/ JUN, p-ERK1/2/ ERK1/2, and p-p38/ p38 to β-actin. Protein was separated by 12% SDS-PAGE. (C) representative image, and (D) quantification of p-PI3K/ PI3K, p-mTOR/ mTOR, p-Akt (Ser473)/ t-Akt, and p-Akt (Thr308)/ t-Akt to β-actin. Protein was separated by 12% SDS-PAGE. (C) representative image, and (D) quantification of p-PI3K, p-mTOR, p-Akt (Ser473), and p-Akt (Thr308) to β-actin. # p < 0.05 or ## p < 0.01 in comparison to control cells. * p < 0.05 or *** p < 0.001 in comparison to TGF-β2-induced control cells. Data are the means ±SE (n = 3).


