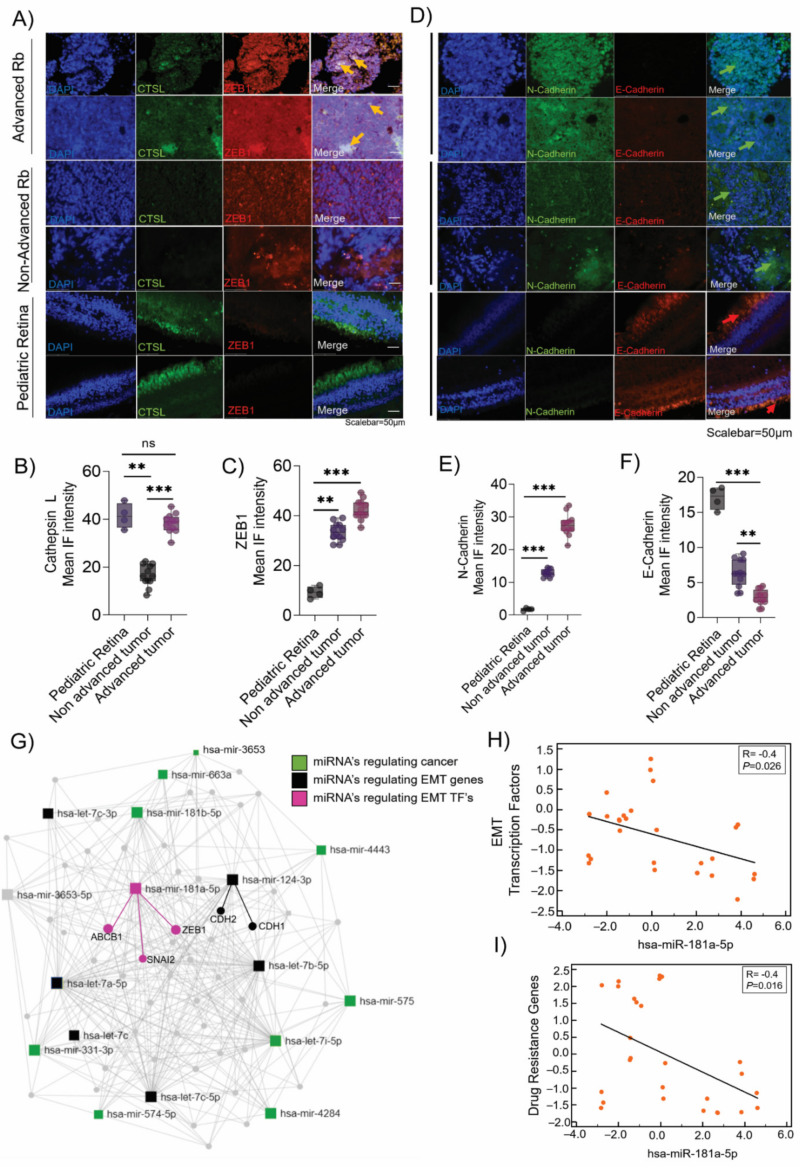
Figure 2.
Validation of epithelial-to-mesenchymal transition (EMT) and chemo-drug resistance genes in Rb tumors and their correlation with miR-181a-5p. Immunofluorescence results showing the expression of (A) ZEB1 and CTSL. The IF mean intensity of (B) ZEB1 and (C) cathepsin L staining in advanced tumors (n = 12), non-advanced tumors (n = 12), and control pediatric retinas (n = 4). Immunofluorescence results showing the expression of (D) N-cadherin and E-cadherin, IF mean intensity of (E) N-cadherin and (F) E-cadherin in advanced tumors (n = 12), non-advanced tumors (n = 12), and control pediatric retina tissues (n = 4). Scale bar: 50 µm. (G) Network map showing the predicted interaction of miRNA–mRNA targets using miRNet. Correlation plot showing the (H) negative correlation of EMT genes (ZEB1, SNAI2, and TWIST) with miR-181a-5p in Rb tumors and (I) negative correlation of drug resistance genes (MDR1, MRP1, and CTSL) with miR-181a-5p in Rb tumors. Values represent the mean ± s.d. Two-tailed Mann–Whitney was used for statistical analysis. ** p < 0.01, *** p < 0.001. ’ns’ represents no statistically significant difference between the means of two variables.

