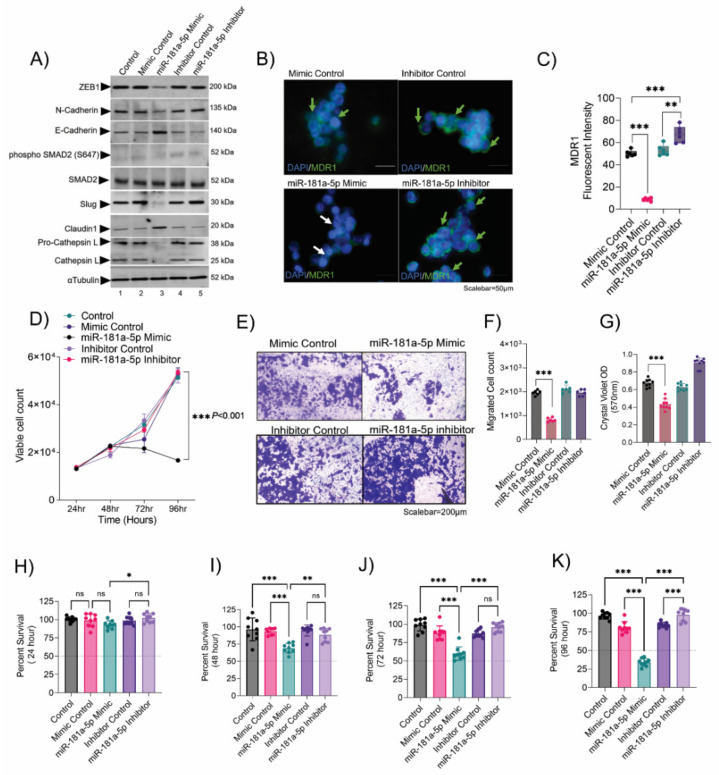
Figure 5.
Resistance depletion by miR-181a-5p conferred sensitivity to chemotherapy. (A) Immunoblot showing the expression of key EMT factors and drug resistance markers upon miR-181a-5p overexpression and inhibition in topotecan-resistant Y79 cells. Uncropped immunoblots are provided in Figure S7. (B) Immunofluorescence showing the MDR1 surface expression in topotecan-resistant Y79 cells upon miR-181a-5p overexpression and inhibition. Scale bar: 50 µm. (C) Bar graphs showing the MDR1 fluorescent intensity in topotecan-resistant Y79 cells upon miR-181a-5p overexpression and inhibition. (D) Trypan blue cell count showing the proliferation of topotecan-resistant cells at 24 h, 48 h, 72 h, and 96 h upon miR-181a-5p overexpression and inhibition. (E) Transwell invasion and migration assay to assess the invasive and migratory capacity of topotecan-resistant cells upon miR-181a-5p overexpression and inhibition. (F) Crystal violet OD measurement at 570 nm to assess the invasiveness of resistant Y79 cells. (G) Trypan blue cell count showing the migrated cells in the lower compartment of the transwell chamber. Chemosensitivity of miR-181a-5p modulated topotecan-resistant Y79 cells upon 10 nM topotecan treatment for (H) 24 h, (I) 48 h, (J) 72 h, and (K) 96 h. The control represents untreated topotecan-resistant Y79 cells. Two-tailed Student’s t-test (for 2< group) and one-way ANOVA with Dunnett’s multiple comparisons tests (for >2 groups) were used for the statistical analysis. * p < 0.05, ** p < 0.01, *** p < 0.001. ‘ns’ represents no statistically significant difference between the means of two variables.

