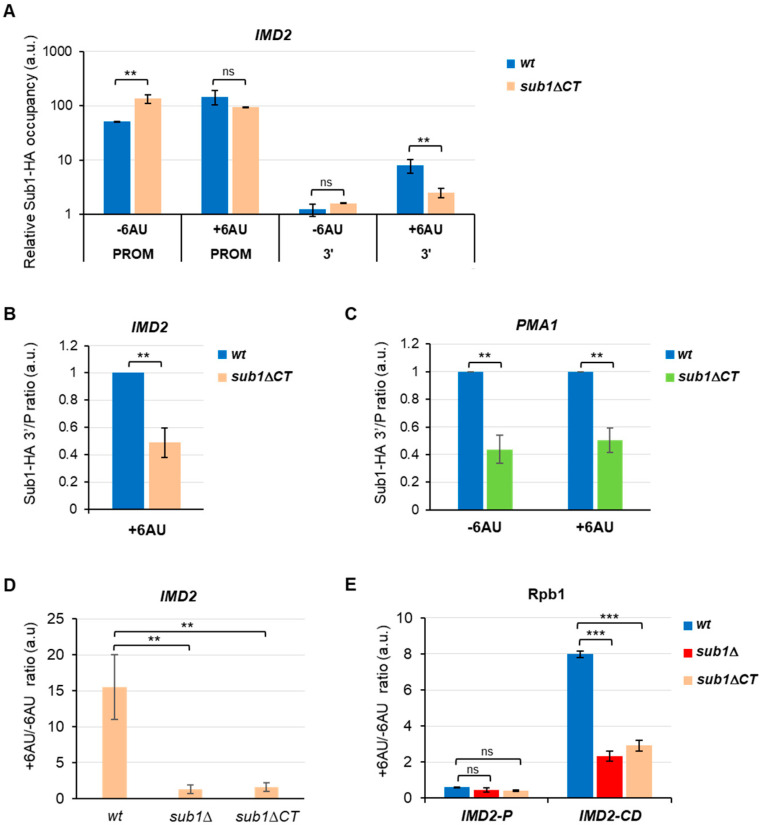
Figure 5.
The C-terminal region of Sub1 is required for proper IMD2 expression. (A) Sub1-HA relative occupancy at the promoter, as well as 3′ regions of the IMD2 gene in wt and sub1ΔCT cells were analyzed by ChIP in the presence or absence of 100 μg/mL 6AU. Data represented in the graph were calculated and plotted as shown in Figure 4A; a logarithmic scale has been used to highlight the association defects at the 3′-end regions compared to the promoter region of the IMD2 gene. (B) The 3′/P association ratio for IMD2. (C) The 3′/P association ratio for PMA1 gene in the presence or absence of 100 μg/mL 6AU. (D) RT-qPCR to analyze IMD2 gene expression; total RNA was purified from wt, sub1Δ, and sub1ΔCT cells grown in SC-URA, with or without 100 μg/mL 6AU, with synthesized cDNA and used qPCR reactions. The values from the reaction with IMD2 mRNA were normalized to 18S rRNA, and the +6AU/-6AU ratio for wt, sub1Δ, and sub1ΔCT cells was calculated and graphed. (E) Relative Rpb1 occupancy, at the promoter and coding regions of the IMD2 gene, was examined by ChIP in wt, sub1Δ, and sub1ΔCT cells before and after 6AU (100 μg/mL) treatment. The Rpb1 binding (promoter, P, and coding regions, CD) was measured in all the cells, as shown in (A), and then, the +6AU/-6AU ratio was estimated and represented. Error bars are standard deviations. Statistically significant levels are shown where ns = non-significant, ** = p < 0.01, ***= p < 0.001.

