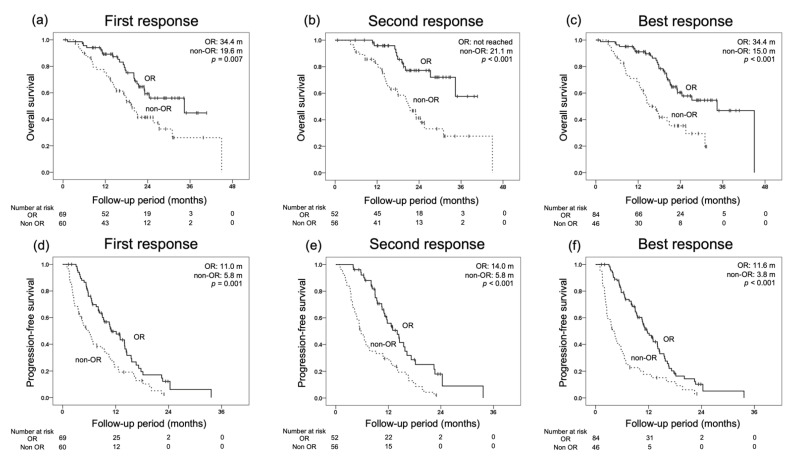
Figure 2.
Comparison of overall survival (OS) and progression-free survival (PFS) by the response at the first, second, and best responses as evaluated by modified Response Evaluation Criteria in Solid Tumors (mRECIST). (a) OS at the first response (objective response (OR) 34.4 months, non-OR 19.6 months, p = 0.007). (b) OS at the second response (OR not-reached, non-OR 21.1 months, p < 0.001). (c) OS at the best response (OR 34.4 months, non-OR 15.0 months, p < 0.001). (d) PFS at the first response (OR 11.0 months, non-OR 5.8 months, p = 0.001). (e) PFS at the second response (OR 14.0 months, non-OR 5.8 months, p < 0.001). (f) PFS at the best response (OR 11.6 months, non-OR 3.8 months, p < 0.001).

